Under Armour 2012 Annual Report Download - page 41
Download and view the complete annual report
Please find page 41 of the 2012 Under Armour annual report below. You can navigate through the pages in the report by either clicking on the pages listed below, or by using the keyword search tool below to find specific information within the annual report.-
 1
1 -
2
-
3
-
4
-
5
-
6
-
7
-
8
-
9
-
10
-
11
-
12
-
13
-
14
-
15
-
16
-
17
-
18
-
19
-
20
-
21
-
22
-
23
-
24
-
25
-
26
-
27
-
28
-
29
-
30
-
 31
31 -
 32
32 -
 33
33 -
 34
34 -
 35
35 -
 36
36 -
 37
37 -
 38
38 -
 39
39 -
 40
40 -
 41
41 -
 42
42 -
 43
43 -
 44
44 -
 45
45 -
 46
46 -
 47
47 -
 48
48 -
 49
49 -
 50
50 -
 51
51 -
52
-
53
-
54
-
55
-
56
-
57
-
58
-
59
-
60
-
61
-
62
-
63
-
64
-
65
-
66
-
67
-
68
-
69
-
70
-
71
-
72
-
73
-
74
-
75
-
76
-
77
-
78
-
79
-
80
-
81
-
82
-
83
-
84
-
85
-
86
-
87
-
88
-
89
-
90
-
91
-
92
-
93
-
94
-
95
-
96
 |
 |

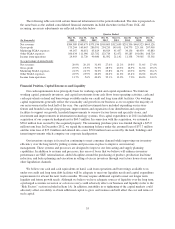
• Corporate services costs increased $15.7 million to $114.3 million for the year ended December 31,
2011 from $98.6 million for the same period in 2010. This increase was attributable primarily to
increased corporate personnel, facility costs and information technology initiatives necessary to support
our growth. As a percentage of net revenues, corporate services costs decreased to 7.7% for the year
ended December 31, 2011 from 9.3% for the same period in 2010 primarily due to decreased corporate
personnel and facility costs as a percentage of net revenues, as well as the net impact of the acquisition
of our corporate headquarters in 2011.
Income from operations increased $50.4 million, or 44.9%, to $162.8 million in 2011 from $112.4 million in
2010. Income from operations as a percentage of net revenues increased to 11.1% in 2011 from 10.6% in 2010.
This increase was a result of the items discussed above.
Interest expense, net increased $1.5 million to $3.8 million in 2011 from $2.3 million in 2010. This increase
was primarily due to the debt related to the acquisition of our corporate headquarters.
Other expense, net increased $0.9 million to $2.1 million in 2011 from $1.2 million in 2010. This increase
was due to higher net losses in 2011 on the combined foreign currency exchange rate changes on transactions
denominated in foreign currencies and our derivative foreign currency financial instruments as compared to
2010.
Provision for income taxes increased $19.5 million to $59.9 million in 2011 from $40.4 million in 2010. Our
effective tax rate was 38.2% in 2011 compared to 37.1% in 2010, primarily due to federal and state tax credits
that reduced the effective tax rate in the prior year period, partially offset by the 2011 reversal of a valuation
allowance established in 2010 against a portion of our deferred tax assets related to foreign net operating loss
carryforwards.
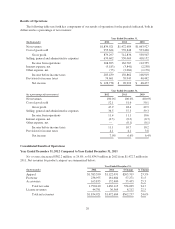
Segment Results of Operations
Year Ended December 31, 2012 Compared to Year Ended December 31, 2011
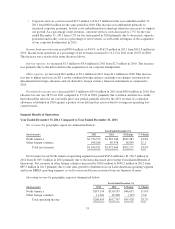
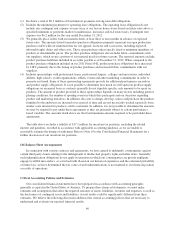
Net revenues by geographic region are summarized below:
Year Ended December 31,
(In thousands) 2012 2011 $ Change % Change
North America $1,726,733 $1,383,346 $343,387 24.8%
Other foreign countries 108,188 89,338 18,850 21.1
Total net revenues $1,834,921 $1,472,684 $362,237 24.6%
Net revenues in our North American operating segment increased $343.4 million to $1,726.7 million in
2012 from $1,383.3 million in 2011 primarily due to the items discussed above in the Consolidated Results of
Operations. Net revenues in other foreign countries increased by $18.9 million to $108.2 million in 2012 from
$89.3 million in 2011 primarily due to unit sales growth to distributors in our Latin American operating segment
and in our EMEA operating segment, as well as increased license revenues from our Japanese licensee.
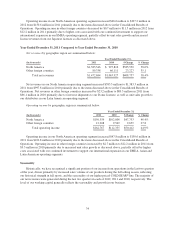
Operating income by geographic region is summarized below:
Year Ended December 31,
(In thousands) 2012 2011 $ Change % Change
North America $197,194 $150,559 $46,635 31.0%
Other foreign countries 11,501 12,208 (707) (5.8)
Total operating income $208,695 $162,767 $45,928 28.2%
33