Under Armour 2012 Annual Report Download - page 38
Download and view the complete annual report
Please find page 38 of the 2012 Under Armour annual report below. You can navigate through the pages in the report by either clicking on the pages listed below, or by using the keyword search tool below to find specific information within the annual report.-
 1
1 -
2
-
3
-
4
-
5
-
6
-
7
-
8
-
9
-
10
-
11
-
12
-
13
-
14
-
15
-
16
-
17
-
18
-
19
-
20
-
21
-
22
-
23
-
24
-
25
-
26
-
27
-
 28
28 -
 29
29 -
 30
30 -
 31
31 -
 32
32 -
 33
33 -
 34
34 -
 35
35 -
 36
36 -
 37
37 -
 38
38 -
 39
39 -
 40
40 -
 41
41 -
 42
42 -
 43
43 -
 44
44 -
 45
45 -
 46
46 -
 47
47 -
 48
48 -
49
-
50
-
51
-
52
-
53
-
54
-
55
-
56
-
57
-
58
-
59
-
60
-
61
-
62
-
63
-
64
-
65
-
66
-
67
-
68
-
69
-
70
-
71
-
72
-
73
-
74
-
75
-
76
-
77
-
78
-
79
-
80
-
81
-
82
-
83
-
84
-
85
-
86
-
87
-
88
-
89
-
90
-
91
-
92
-
93
-
94
-
95
-
96
 |
 |
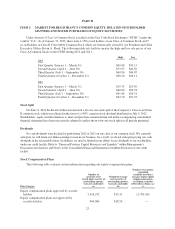
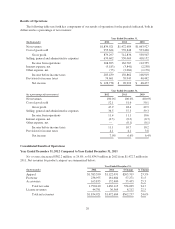
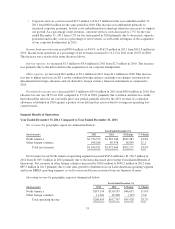
Net sales increased $354.0 million, or 24.7%, to $1,790.1 million in 2012 from $1,436.1 million in 2011 as
noted in the table above. The increase in net sales primarily reflects:
• $134.7 million, or 33.8%, increase in direct to consumer sales, which includes 22 additional factory
house stores, or a 27.5% increase, since December 31, 2011; and
• unit growth driven by increased distribution and new offerings in multiple product categories, most
significantly in our training, hunting, running, baselayer and studio apparel product categories and
running footwear category, including the launch of coldblack apparel, Armour Bra and Under Armour
scent control products and our UA Spine footwear; and
• increased average selling prices due to a higher mix in the current year period of direct to consumer
sales, along with increasing sales of our higher priced products such as Fleece, our women’s UA Studio
line and UA Spine footwear.
License revenues increased $8.2 million, or 22.5%, to $44.8 million in 2012 from $36.6 million in 2011.
This increase in license revenues was a result of increased distribution and continued unit volume growth by our
licensees.
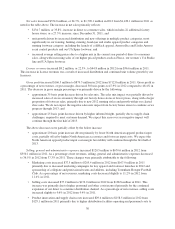
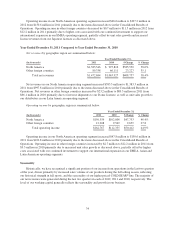
Gross profit increased $166.5 million to $879.3 million in 2012 from $712.8 million in 2011. Gross profit as
a percentage of net revenues, or gross margin, decreased 50 basis points to 47.9% in 2012 compared to 48.4% in
2011. The decrease in gross margin percentage was primarily driven by the following:
• approximate 35 basis point decrease driven by sales mix. The sales mix impact was partially driven by
increased sales of excess inventory through our factory house stores at lower prices, along with a larger
proportion of footwear sales, primarily due to new 2012 running styles and growth within our cleated
shoe sales. We do not expect the negative sales mix impact from factory house stores to continue as we
progress through 2013; and
• approximate 25 basis point decrease driven by higher inbound freight, partially due to supply chain
challenges, required to meet customer demand. We expect this year over year negative impact will
continue through the first half of 2013.
The above decreases were partially offset by the below increase:
• approximate 20 basis point increase driven primarily by lower North American apparel product input
costs, partially offset by higher North American accessories and footwear input costs. We expect the
North American apparel product input cost margin favorability will continue through the first half of
2013.
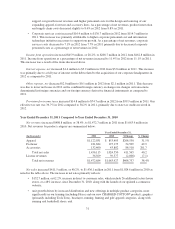
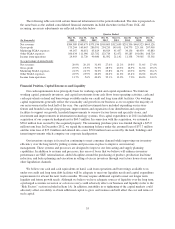
Selling, general and administrative expenses increased $120.5 million to $670.6 million in 2012 from
$550.1 million in 2011. As a percentage of net revenues, selling, general and administrative expenses decreased
to 36.5% in 2012 from 37.3% in 2011. These changes were primarily attributable to the following:
• Marketing costs increased $37.5 million to $205.4 million in 2012 from $167.9 million in 2011
primarily due to increased marketing campaigns for key apparel and footwear launches in 2012 and
sponsorship of collegiate and professional teams and athletes, including Tottenham Hotspur Football
Club. As a percentage of net revenues, marketing costs decreased slightly to 11.2% in 2012 from
11.4% in 2011.
• Selling costs increased $37.2 million to $176.0 million in 2012 from $138.8 million in 2011. This
increase was primarily due to higher personnel and other costs incurred primarily for the continued
expansion of our direct to consumer distribution channel. As a percentage of net revenues, selling costs
increased slightly to 9.6% in 2012 from 9.4% in 2011.
• Product innovation and supply chain costs increased $29.4 million to $158.5 million in 2012 from
$129.1 million in 2011 primarily due to higher distribution facilities operating and personnel costs to
30