Under Armour 2012 Annual Report Download - page 34
Download and view the complete annual report
Please find page 34 of the 2012 Under Armour annual report below. You can navigate through the pages in the report by either clicking on the pages listed below, or by using the keyword search tool below to find specific information within the annual report.-
 1
1 -
2
-
3
-
4
-
5
-
6
-
7
-
8
-
9
-
10
-
11
-
12
-
13
-
14
-
15
-
16
-
17
-
18
-
19
-
20
-
21
-
22
-
23
-
 24
24 -
 25
25 -
 26
26 -
 27
27 -
 28
28 -
 29
29 -
 30
30 -
 31
31 -
 32
32 -
 33
33 -
 34
34 -
 35
35 -
 36
36 -
 37
37 -
 38
38 -
 39
39 -
 40
40 -
 41
41 -
 42
42 -
 43
43 -
 44
44 -
45
-
46
-
47
-
48
-
49
-
50
-
51
-
52
-
53
-
54
-
55
-
56
-
57
-
58
-
59
-
60
-
61
-
62
-
63
-
64
-
65
-
66
-
67
-
68
-
69
-
70
-
71
-
72
-
73
-
74
-
75
-
76
-
77
-
78
-
79
-
80
-
81
-
82
-
83
-
84
-
85
-
86
-
87
-
88
-
89
-
90
-
91
-
92
-
93
-
94
-
95
-
96
 |
 |

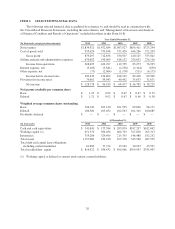
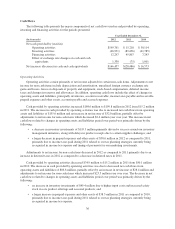
ITEM 6. SELECTED FINANCIAL DATA
The following selected financial data is qualified by reference to, and should be read in conjunction with,
the Consolidated Financial Statements, including the notes thereto, and “Management’s Discussion and Analysis
of Financial Condition and Results of Operations” included elsewhere in this Form 10-K.
Year Ended December 31,
(In thousands, except per share amounts) 2012 2011 2010 2009 2008
Net revenues $1,834,921 $1,472,684 $1,063,927 $856,411 $725,244
Cost of goods sold 955,624 759,848 533,420 446,286 372,203
Gross profit 879,297 712,836 530,507 410,125 353,041
Selling, general and administrative expenses 670,602 550,069 418,152 324,852 276,116
Income from operations 208,695 162,767 112,355 85,273 76,925
Interest expense, net (5,183) (3,841) (2,258) (2,344) (850)
Other expense, net (73) (2,064) (1,178) (511) (6,175)
Income before income taxes 203,439 156,862 108,919 82,418 69,900
Provision for income taxes 74,661 59,943 40,442 35,633 31,671
Net income $ 128,778 $ 96,919 $ 68,477 $ 46,785 $ 38,229
Net income available per common share
Basic $ 1.23 $ 0.94 $ 0.67 $ 0.47 $ 0.39
Diluted $ 1.21 $ 0.92 $ 0.67 $ 0.46 $ 0.38
Weighted average common shares outstanding
Basic 104,343 103,140 101,595 99,696 98,171
Diluted 106,380 105,052 102,563 101,301 100,685
Dividends declared $ — $ — $ — $ — $ —
At December 31,
(In thousands) 2012 2011 2010 2009 2008
Cash and cash equivalents $ 341,841 $ 175,384 $ 203,870 $187,297 $102,042
Working capital (1) 651,370 506,056 406,703 327,838 263,313
Inventories 319,286 324,409 215,355 148,488 182,232
Total assets 1,157,083 919,210 675,378 545,588 487,555
Total debt and capital lease obligations,
including current maturities 61,889 77,724 15,942 20,223 45,591
Total stockholders’ equity $ 816,922 $ 636,432 $ 496,966 $399,997 $331,097
(1) Working capital is defined as current assets minus current liabilities.
26