Under Armour 2012 Annual Report Download - page 37
Download and view the complete annual report
Please find page 37 of the 2012 Under Armour annual report below. You can navigate through the pages in the report by either clicking on the pages listed below, or by using the keyword search tool below to find specific information within the annual report.-
 1
1 -
2
-
3
-
4
-
5
-
6
-
7
-
8
-
9
-
10
-
11
-
12
-
13
-
14
-
15
-
16
-
17
-
18
-
19
-
20
-
21
-
22
-
23
-
24
-
25
-
26
-
 27
27 -
 28
28 -
 29
29 -
 30
30 -
 31
31 -
 32
32 -
 33
33 -
 34
34 -
 35
35 -
 36
36 -
 37
37 -
 38
38 -
 39
39 -
 40
40 -
 41
41 -
 42
42 -
 43
43 -
 44
44 -
 45
45 -
 46
46 -
 47
47 -
48
-
49
-
50
-
51
-
52
-
53
-
54
-
55
-
56
-
57
-
58
-
59
-
60
-
61
-
62
-
63
-
64
-
65
-
66
-
67
-
68
-
69
-
70
-
71
-
72
-
73
-
74
-
75
-
76
-
77
-
78
-
79
-
80
-
81
-
82
-
83
-
84
-
85
-
86
-
87
-
88
-
89
-
90
-
91
-
92
-
93
-
94
-
95
-
96
 |
 |

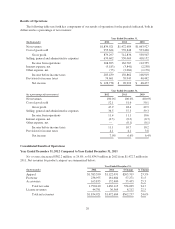
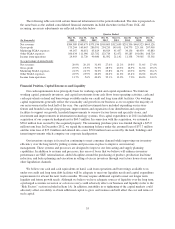
Results of Operations
The following table sets forth key components of our results of operations for the periods indicated, both in
dollars and as a percentage of net revenues:
Year Ended December 31,
(In thousands) 2012 2011 2010
Net revenues $1,834,921 $1,472,684 $1,063,927
Cost of goods sold 955,624 759,848 533,420
Gross profit 879,297 712,836 530,507
Selling, general and administrative expenses 670,602 550,069 418,152
Income from operations 208,695 162,767 112,355
Interest expense, net (5,183) (3,841) (2,258)
Other expense, net (73) (2,064) (1,178)
Income before income taxes 203,439 156,862 108,919
Provision for income taxes 74,661 59,943 40,442
Net income $ 128,778 $ 96,919 $ 68,477
Year Ended December 31,
(As a percentage of net revenues) 2012 2011 2010
Net revenues 100.0% 100.0% 100.0%
Cost of goods sold 52.1 51.6 50.1
Gross profit 47.9 48.4 49.9
Selling, general and administrative expenses 36.5 37.3 39.3
Income from operations 11.4 11.1 10.6
Interest expense, net (0.3) (0.3) (0.3)
Other expense, net — (0.1) (0.1)
Income before income taxes 11.1 10.7 10.2
Provision for income taxes 4.1 4.1 3.8
Net income 7.0% 6.6% 6.4%
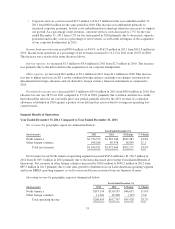
Consolidated Results of Operations
Year Ended December 31, 2012 Compared to Year Ended December 31, 2011
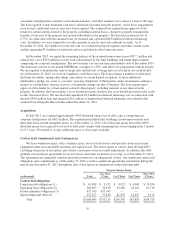
Net revenues increased $362.2 million, or 24.6%, to $1,834.9 million in 2012 from $1,472.7 million in
2011. Net revenues by product category are summarized below:
Year Ended December 31,
(In thousands) 2012 2011 $ Change % Change
Apparel $1,385,350 $1,122,031 $263,319 23.5%
Footwear 238,955 181,684 57,271 31.5
Accessories 165,835 132,400 33,435 25.3
Total net sales 1,790,140 1,436,115 354,025 24.7
License revenues 44,781 36,569 8,212 22.5
Total net revenues $1,834,921 $1,472,684 $362,237 24.6%
29