Sharp 2008 Annual Report Download - page 63
Download and view the complete annual report
Please find page 63 of the 2008 Sharp annual report below. You can navigate through the pages in the report by either clicking on the pages listed below, or by using the keyword search tool below to find specific information within the annual report.-
 1
1 -
2
-
3
-
4
-
5
-
6
-
7
-
8
-
9
-
10
-
11
-
12
-
13
-
14
-
15
-
16
-
17
-
18
-
19
-
20
-
21
-
22
-
23
-
24
-
25
-
26
-
27
-
28
-
29
-
30
-
31
-
32
-
33
-
34
-
35
-
36
-
37
-
38
-
39
-
40
-
41
-
42
-
43
-
44
-
45
-
46
-
47
-
48
-
49
-
50
-
51
-
52
-
 53
53 -
 54
54 -
 55
55 -
 56
56 -
 57
57 -
 58
58 -
 59
59 -
 60
60 -
 61
61 -
 62
62 -
 63
63 -
 64
64 -
 65
65 -
 66
66 -
 67
67 -
 68
68
 |
 |

62
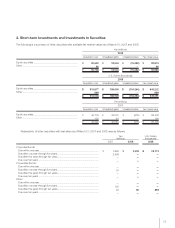
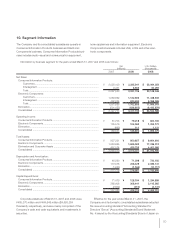
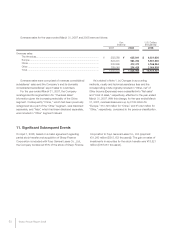
Corporate assets as of March 31, 2007 and 2008 were
¥485,370 million and ¥464,645 million ($4,693,384
thousand), respectively, and were mainly comprised of the
Company’s cash and cash equivalents and investments in
securities.
For the year ended March 31, 2007, a new geographic
segment “China,” which had been previously categorized as a
part of the “Other” segment, was disclosed separately, and
“Asia,” which had been disclosed separately, was included in
“Other” segment instead, given the increasing materiality of
the China segment. Consequently the geographic segment
“Other” principally consists of “Asia,” “Middle East” and
“Oceania” region.
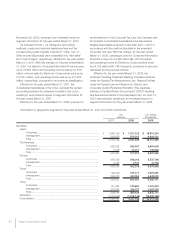
Effective for the year ended March 31, 2007, the
Company and its domestic consolidated subsidiaries adopted
the new accounting standard “Accounting Standard for
Directors’ Bonus” (Accounting Standards Board Statement
No. 4 issued by the Accounting Standards Board of Japan on
November 29, 2005), resulting in an immaterial impact on
segment information for the year ended March 31, 2007.
As is stated in Note 1. (n) Changes in accounting
methods, royalty and technical assistance fees and the
corresponding costs originally included in “Other, net” of
Other Income (Expenses) were reclassified into “Net sales”
and “Cost of sales,” respectively, effective for the year ended
March 31, 2007. With this change, for the year ended March
31, 2007, net sales for “Japan” were up by ¥38,151 million
and operating income was up by ¥17,372 million. Also, net
sales for “Elimination” were down by ¥22,537 million and
operating income was down by ¥6,216 million, compared to
the previous classification.
Effective for the year ended March 31, 2007, the
consolidated subsidiaries in the U.S.A. adopted the revised
accounting standard for retirement benefits in the U.S.A.,
resulting in an immaterial impact on segment information for
the year ended March 31, 2007.
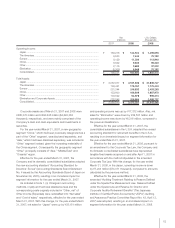
Effective for the year ended March 31, 2008, pursuant to
an amendment to the Corporate Tax Law, the Company and
its domestic consolidated subsidiaries have depreciated
tangible fixed assets acquired on and after April 1, 2007 in
accordance with the method stipulated in the amended
Corporate Tax Law. With this change, for the year ended
March 31, 2008, in the Japan, operating income is down
by ¥7,234 million ($73,071 thousand), compared to amounts
calculated by the previous method.
Effective for the year ended March 31, 2008, the
amended “Auditing Treatment Relating to Reserve Defined
under the Special Tax Measurement Law, Reserve Defined
under the Special Law and Reserve for Director and
Corporate Auditor Retirement Benefits” (The Japanese
Institute of Certified Public Accountants (“JICPA”) Auditing
and Assurance Practice Committee Report No. 42, April 13,
2007) was adopted, resulting in an immaterial impact on
segment information for the year ended March 31, 2008.
Operating Income:
Japan ..........................................................................................................
The Americas ..............................................................................................
Europe ........................................................................................................
China...........................................................................................................
Other...........................................................................................................
Elimination...................................................................................................
Consolidated ...............................................................................................
Total Assets:
Japan ..........................................................................................................
The Americas ..............................................................................................
Europe ........................................................................................................
China...........................................................................................................
Other...........................................................................................................
Elimination and Corporate Assets ................................................................
Consolidated ...............................................................................................
$ 1,459,616
75,192
113,940
99,343
37,202
70,182
$ 1,855,475
$ 21,836,727
1,775,424
2,493,263
1,887,970
959,374
2,089,737
$ 31,042,495
¥ 144,502
7,444
11,280
9,835
3,683
6,948
¥ 183,692
¥ 2,161,836
175,767
246,833
186,909
94,978
206,884
¥ 3,073,207
¥ 163,216
9,533
8,129
8,842
2,116
(5,305)
¥ 186,531
¥ 2,057,977
193,451
231,344
153,600
103,592
228,846
¥ 2,968,810
200820082007
Yen
(millions) U.S. Dollars
(thousands)