Sharp 2008 Annual Report Download - page 54
Download and view the complete annual report
Please find page 54 of the 2008 Sharp annual report below. You can navigate through the pages in the report by either clicking on the pages listed below, or by using the keyword search tool below to find specific information within the annual report.-
 1
1 -
2
-
3
-
4
-
5
-
6
-
7
-
8
-
9
-
10
-
11
-
12
-
13
-
14
-
15
-
16
-
17
-
18
-
19
-
20
-
21
-
22
-
23
-
24
-
25
-
26
-
27
-
28
-
29
-
30
-
31
-
32
-
33
-
34
-
35
-
36
-
37
-
38
-
39
-
40
-
41
-
42
-
43
-
 44
44 -
 45
45 -
 46
46 -
 47
47 -
 48
48 -
 49
49 -
 50
50 -
 51
51 -
 52
52 -
 53
53 -
 54
54 -
 55
55 -
 56
56 -
 57
57 -
 58
58 -
 59
59 -
 60
60 -
 61
61 -
 62
62 -
 63
63 -
 64
64 -
65
-
66
-
67
-
68
 |
 |

53 Sharp Annual Report 2008
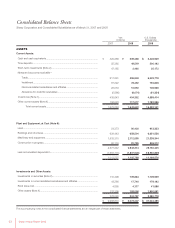
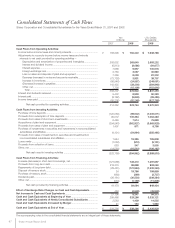
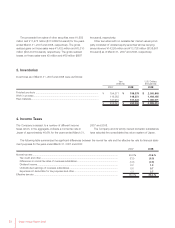
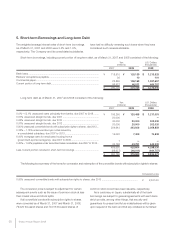
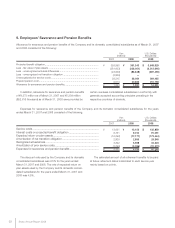
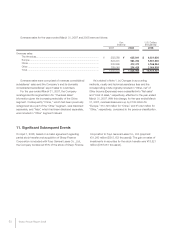
3. Inventories
Finished products ............................................................................................
Work in process ...............................................................................................
Raw materials...................................................................................................
$ 2,005,848
1,498,495
1,085,071
$ 4,589,414
¥ 198,579
148,351
107,422
¥ 454,352
¥ 194,371
119,362
121,910
¥ 435,643
200820082007
Yen
(millions) U.S. Dollars
(thousands)
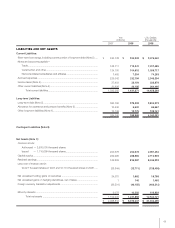
The following table summarizes the significant differences between the normal tax rate and the effective tax rate for financial state-
ment purposes for the years ended March 31, 2007 and 2008:
Normal tax rate .............................................................................................................................
Tax credit and other.................................................................................................................
Differences in normal tax rates of overseas subsidiaries............................................................
Dividend income ......................................................................................................................
Undistributed earnings of overseas subsidiaries .......................................................................
Expenses not deductible for tax purposes and other................................................................
Effective tax rate ...........................................................................................................................
40.6 %
(6.0)
(2.9)
1.3
0.7
2.7
36.4 %
2008
40.6 %
(7.5)
(1.9)
2.2
0.6
1.3
35.3 %
2007
4. Income Taxes
The Company is subject to a number of different income
taxes which, in the aggregate, indicate a normal tax rate in
Japan of approximately 40.6% for the years ended March 31,
2007 and 2008.
T
he Company and its wholly owned domestic subsidiaries
have adopted the consolidated tax return system of Japan.
Inventories as of March 31, 2007 and 2008 were as follows:
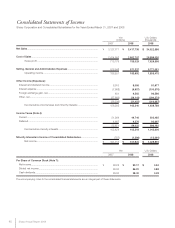
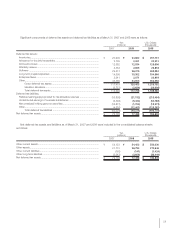
The proceeds from sales of other securities were ¥1,882
million and ¥11,275 million ($113,889 thousand) for the years
ended March 31, 2007 and 2008, respectively. The gross
realized gains on those sales were ¥1,432 million and ¥3,310
million ($33,434 thousand), respectively. The gross realized
losses on those sales were ¥2 million and ¥69 million ($697
thousand), respectively.
Other securities with no available fair market values princi-
pally consisted of unlisted equity securities whose carrying
amounts were ¥14,326 million and ¥13,728 million ($138,667
thousand) as of March 31, 2007 and 2008, respectively.