Sharp 2008 Annual Report Download - page 40
Download and view the complete annual report
Please find page 40 of the 2008 Sharp annual report below. You can navigate through the pages in the report by either clicking on the pages listed below, or by using the keyword search tool below to find specific information within the annual report.-
 1
1 -
2
-
3
-
4
-
5
-
6
-
7
-
8
-
9
-
10
-
11
-
12
-
13
-
14
-
15
-
16
-
17
-
18
-
19
-
20
-
21
-
22
-
23
-
24
-
25
-
26
-
27
-
28
-
29
-
 30
30 -
 31
31 -
 32
32 -
 33
33 -
 34
34 -
 35
35 -
 36
36 -
 37
37 -
 38
38 -
 39
39 -
 40
40 -
 41
41 -
 42
42 -
 43
43 -
 44
44 -
 45
45 -
 46
46 -
 47
47 -
 48
48 -
 49
49 -
 50
50 -
51
-
52
-
53
-
54
-
55
-
56
-
57
-
58
-
59
-
60
-
61
-
62
-
63
-
64
-
65
-
66
-
67
-
68
 |
 |

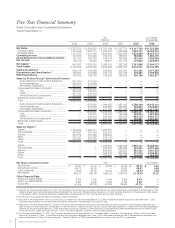
39 Sharp Annual Report 2008
04 05 06 0807
121
163
0
50
100
150
200
186 183
151
0
3
6
9
12
0
30
60
90
120
04 05 06 0807
0
2
4
6
8
76
60
101 101
88
04 05 06 0807
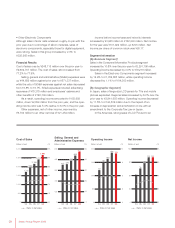
1,713
1,959
2,165
2,414
0
500
1,000
1,500
2,000
2,500
3,000
65
70
75
80
85
90
95
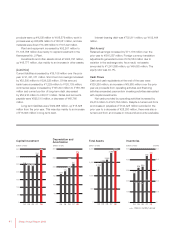
2,662
04 05 06 0807
422
468
0
120
240
360
480
600
526
571
429
0
10
20
30
40
50
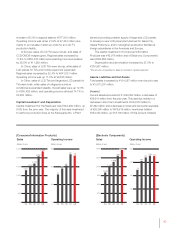
•Other Electronic Components
Although sales of solar cells remained roughly on par with the
prior year due to a shortage of silicon materials, sales of
electronic components, especially those for digital equipment,
were strong. Sales in this group increased by 2.0% to
¥325,265 million.
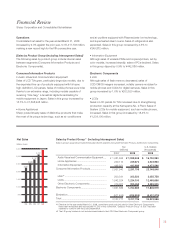
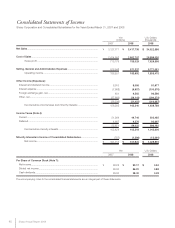
Financial Results
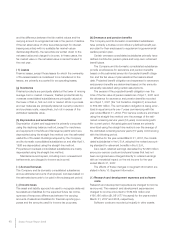
Cost of sales rose by ¥248,115 million over the prior year to
¥2,662,707 million. The cost of sales ratio increased from
77.2% to 77.9%.
Selling, general and administrative (SG&A) expenses were
up ¥44,689 million against prior year to ¥571,337 million,
while the ratio of SG&A expenses against net sales decreased
from 16.8% to 16.7%. SG&A expenses included advertising
expenses of ¥75,375 million and employees’ salaries and
other benefits of ¥126,739 million.
As a result, operating income amounted to ¥183,692
million, down ¥2,839 million from the prior year, and the oper-
ating income ratio was 5.4% relative to 6.0% in the prior year.
Other expenses, net of other income, improved by
¥6,784 million to an other net loss of ¥21,452 million.
Income before income taxes and minority interests
increased by ¥3,945 million to ¥162,240 million. Net income
for the year was ¥101,922 million, up ¥205 million. Net
income per share of common stock was ¥93.17.
Segment Information
[By Business Segment]
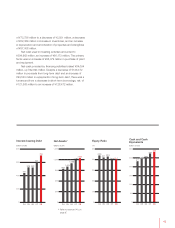
Sales in the Consumer/Information Products segment
increased by 10.8% over the prior year to ¥2,291,706 million.
Operating income decreased by 3.0% to ¥79,218 million.
Sales in the Electronic Components segment increased
by 12.9% to ¥1,762,885 million, while operating income
decreased by 1.1% to ¥104,363 million.
[By Geographic Segment]
In Japan, sales of large-size LCD panels for TVs and mobile
phones expanded. Regional sales increased by 6.2% over the
prior year to ¥2,941,635 million. Operating income decreased
by 11.5% to ¥144,502 million due to the impact of an
increase in depreciation and amortization in line with an
amendment to the Corporate Tax Law in Japan.
In the Americas, strong sales of LCD TVs led to an
Operating Income Net IncomeCost of Sales Selling, General and
Administrative Expenses
Ratio to net sales
Ratio to net salesRatio to net salesRatio to net sales
(billions of yen) (%) (billions of yen) (%) (billions of yen) (%) (billions of yen) (%)