Sharp 2008 Annual Report Download - page 38
Download and view the complete annual report
Please find page 38 of the 2008 Sharp annual report below. You can navigate through the pages in the report by either clicking on the pages listed below, or by using the keyword search tool below to find specific information within the annual report.-
 1
1 -
2
-
3
-
4
-
5
-
6
-
7
-
8
-
9
-
10
-
11
-
12
-
13
-
14
-
15
-
16
-
17
-
18
-
19
-
20
-
21
-
22
-
23
-
24
-
25
-
26
-
27
-
 28
28 -
 29
29 -
 30
30 -
 31
31 -
 32
32 -
 33
33 -
 34
34 -
 35
35 -
 36
36 -
 37
37 -
 38
38 -
 39
39 -
 40
40 -
 41
41 -
 42
42 -
 43
43 -
 44
44 -
 45
45 -
 46
46 -
 47
47 -
 48
48 -
49
-
50
-
51
-
52
-
53
-
54
-
55
-
56
-
57
-
58
-
59
-
60
-
61
-
62
-
63
-
64
-
65
-
66
-
67
-
68
 |
 |

37 Sharp Annual Report 2008
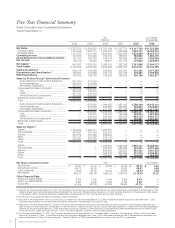
Five-Year Financial Summary
Sharp Corporation and Consolidated Subsidiaries
Years Ended March 31
200820082007200620052004
Yen
(millions) U.S. Dollars
(thousands)
*
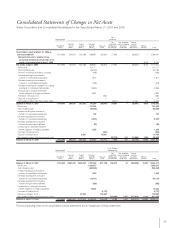
1Effective for the year ended March 31, 2007, the Company adopted the new accounting standards, “Accounting Standard for Presentation of Net Assets in the
Balance Sheet” (Accounting Standards Board Statement No. 5) and the “Implementation Guidance for the Accounting Standard for Presentation of Net Assets
in the Balance Sheet” (Financial Standards Implementation Guidance No. 8). Prior year figures have not been restated.
*
2The amount of properties for lease is included in capital investment.
*
3Pursuant to an amendment to the Corporate Tax Law, effective for the year ended March 31, 2008, tangible fixed assets acquired on and after April 1, 2007,
have been depreciated in accordance with the method stipulated in the amended Corporate Tax Law.
*
4Effective for the year ended March 31, 2006, the IC group was renamed the LSI group and some items previously included in ICs had been reclassified and
were included in Other Electronic Components. In this connection, “Sales by Product Group” of 2005 has been restated to conform with the 2006 presentation.
Effective for the year ended March 31, 2008, some items previously included in Other Electronic Components have been reclassified and are included in LSIs.
In this connection, “Sales by Product Group” of 2007 has been restated to conform with the 2008 presentation.
*
5For the year ended March 31, 2007, the Company recategorized its segmentation for “Overseas sales” information. Consequently, “China,” which had been
previously included in “Other,” is indicated as one of the geographic segments and “Asia,” which had been indicated as one of the geographic segments, has
been reclassified into “Other.” In this connection, “Sales by Region” of 2006 has been restated to conform with the 2007 presentation.
Net Sales .........................................................
Domestic sales................................................
Overseas sales................................................
Operating Income ...........................................
Income Before Income Taxes and Minority Interests
...
Net Income......................................................
Net Assets*1....................................................
Total Assets ....................................................
Capital Investment*2.......................................
Depreciation and Amortization*3....................
R&D Expenditures...........................................
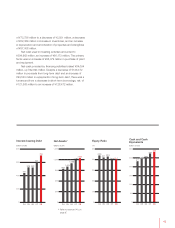
Sales by Product Group*4
Audio-Visual and Communication Equipment
......
Home Appliances.........................................
Information Equipment.....................................
Consumer/Information Products .....................
ICs ..............................................................
LCDs ...........................................................
Other Electronic Components .....................
Electronic Components...................................
Total ...............................................................
Audio-Visual and Communication Equipment
......
Home Appliances.........................................
Information Equipment.....................................
Consumer/Information Products .....................
LSIs .............................................................
LCDs ...........................................................
Other Electronic Components .....................
Electronic Components...................................
Total ...............................................................
Sales by Region*5
Japan..............................................................
The Americas..................................................
Europe............................................................
Asia.................................................................
Other ..............................................................
Total ...............................................................
Japan..............................................................
The Americas..................................................
Europe............................................................
China ..............................................................
Other ..............................................................
Total ...............................................................
Per Share of Common Stock
Net income .....................................................
Diluted net income ..........................................
Cash dividends ..............................................
Net assets.......................................................
Other Financial Data
Return on equity (ROE)....................................
Return on assets (ROA)...................................
Equity ratio ......................................................
$ 34,522,586
16,068,152
18,454,434
1,855,475
1,638,788
1,029,515
12,544,121
31,042,495
3,477,394
2,793,606
1,981,677
—
—
—
—
—
—
—
—
—
16,143,424
2,523,667
4,417,162
23,084,253
1,651,555
6,902,121
2,884,657
11,438,333
34,522,586
—
—
—
—
—
—
16,068,152
6,321,626
5,901,535
4,166,364
2,064,909
34,522,586
$ 0.94
0.88
0.28
11.30
—
—
—
¥ 3,417,736
1,590,747
1,826,989
183,692
162,240
101,922
1,241,868
3,073,207
344,262
276,567
196,186
—
—
—
—
—
—
—
—
—
1,598,199
249,843
437,299
2,285,341
163,504
683,310
285,581
1,132,395
3,417,736
—
—
—
—
—
—
1,590,747
625,841
584,252
412,470
204,426
3,417,736
¥ 93.17
86.91
28.00
1,119.09
8.4%
3.4%
40.1%
¥ 3,127,771
1,526,938
1,600,833
186,531
158,295
101,717
1,192,205
2,968,810
314,301
217,715
189,852
—
—
—
—
—
—
—
—
—
1,381,105
239,081
437,923
2,058,109
146,556
628,821
294,285
1,069,662
3,127,771
—
—
—
—
—
—
1,526,938
582,588
523,301
305,895
189,049
3,127,771
¥ 93.25
90.00
26.00
1,084.76
8.9%
3.7%
39.9%
¥ 2,797,109
1,397,081
1,400,028
163,710
140,018
88,671
1,098,910
2,560,299
238,839
193,114
154,362
—
—
—
—
—
—
—
—
—
1,090,905
224,650
421,208
1,736,763
135,754
633,493
291,099
1,060,346
2,797,109
1,397,081
450,307
488,945
214,131
246,645
2,797,109
1,397,081
450,307
488,945
195,333
265,443
2,797,109
¥ 80.85
—
22.00
1,006.91
8.4%
3.6%
42.9%
¥ 2,539,859
1,329,711
1,210,148
151,020
128,184
76,845
1,004,326
2,385,026
243,388
175,969
148,128
972,563
212,064
416,310
1,600,937
140,915
543,804
254,203
938,922
2,539,859
972,563
212,064
416,310
1,600,937
132,375
543,804
262,743
938,922
2,539,859
1,329,711
372,184
407,455
207,186
223,323
2,539,859
—
—
—
—
—
—
¥ 70.04
69.60
20.00
920.09
7.9%
3.4%
42.1%
¥ 2,257,273
1,143,548
1,113,725
121,670
102,720
60,715
943,532
2,150,250
248,178
159,831
138,786
837,390
208,473
392,833
1,438,696
169,754
421,741
227,082
818,577
2,257,273
—
—
—
—
—
—
—
—
—
1,143,548
308,807
330,772
279,161
194,985
2,257,273
—
—
—
—
—
—
¥ 55.37
54.73
18.00
864.77
6.6%
2.9%
43.9%
Yen U.S. Dollars
(Sales to Outside Customers)