Sharp 2008 Annual Report Download - page 22
Download and view the complete annual report
Please find page 22 of the 2008 Sharp annual report below. You can navigate through the pages in the report by either clicking on the pages listed below, or by using the keyword search tool below to find specific information within the annual report.-
 1
1 -
2
-
3
-
4
-
5
-
6
-
7
-
8
-
9
-
10
-
11
-
 12
12 -
 13
13 -
 14
14 -
 15
15 -
 16
16 -
 17
17 -
 18
18 -
 19
19 -
 20
20 -
 21
21 -
 22
22 -
 23
23 -
 24
24 -
 25
25 -
 26
26 -
 27
27 -
 28
28 -
 29
29 -
 30
30 -
 31
31 -
 32
32 -
33
-
34
-
35
-
36
-
37
-
38
-
39
-
40
-
41
-
42
-
43
-
44
-
45
-
46
-
47
-
48
-
49
-
50
-
51
-
52
-
53
-
54
-
55
-
56
-
57
-
58
-
59
-
60
-
61
-
62
-
63
-
64
-
65
-
66
-
67
-
68
 |
 |
21 Sharp Annual Report 2008
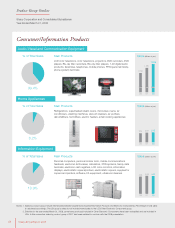
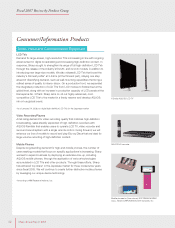
Consumer/Information Products
Product Group Outline
Sharp Corporation and Consolidated Subsidiaries
Year Ended March 31, 2008
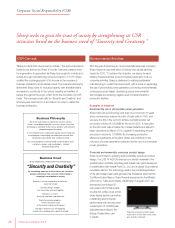
% of Total Sales
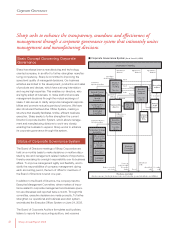
% of Total Sales
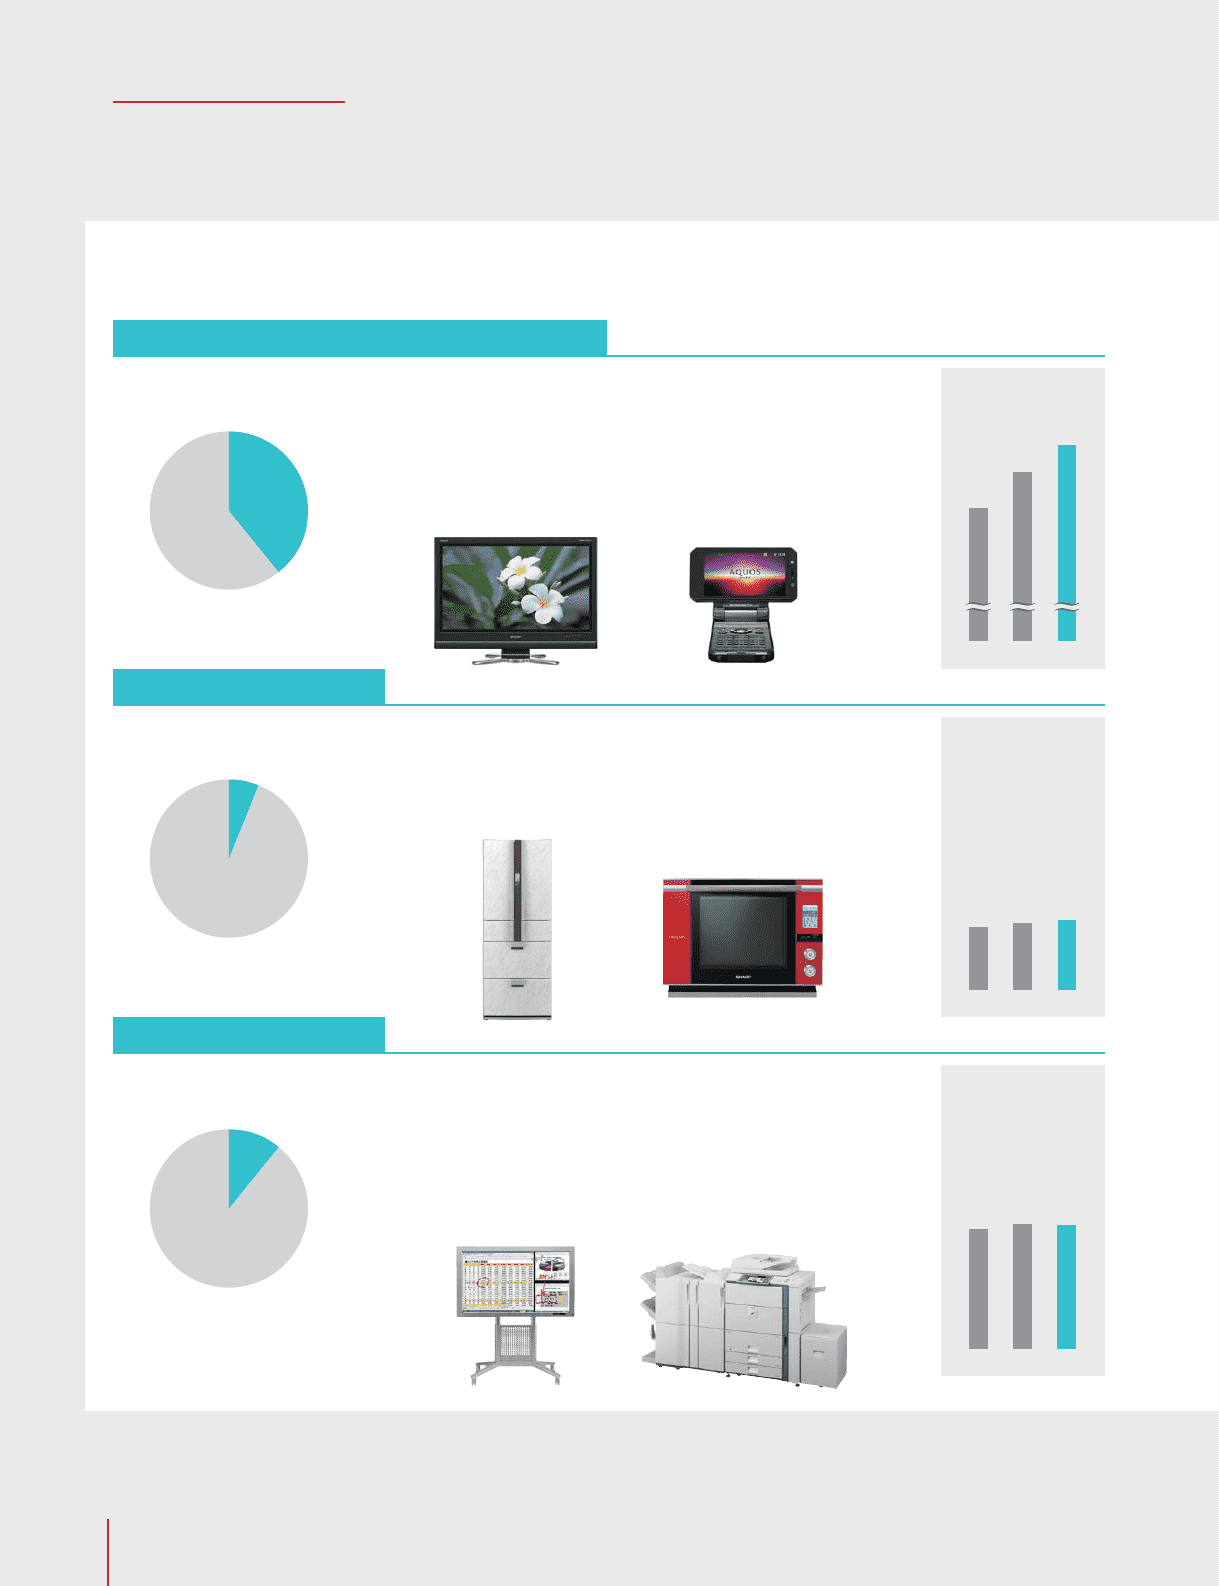
% of Total Sales
LCD color televisions, color televisions, projectors, DVD recorders, DVD
players, Blu-ray Disc recorders, Blu-ray Disc players, 1-bit digital audio
products, facsimiles, telephones, mobile phones, PHS (personal handy-
phone system) terminals
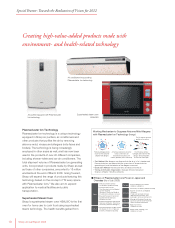
Refrigerators, superheated steam ovens, microwave ovens, air
conditioners, washing machines, vacuum cleaners, air purifiers,
dehumidifiers, humidifiers, electric heaters, small cooking appliances
Personal computers, personal mobile tools, mobile communications
handsets, electronic dictionaries, calculators, POS systems, handy data
terminals, electronic cash registers, LCD color monitors, information
displays, electrostatic copiers/printers, electrostatic copiers, supplies for
copiers and printers, software, FA equipment, ultrasonic cleaners
Sales (billions of yen)
Sales (billions of yen)
Sales (billions of yen)
Main Products
Main Products
Main Products
06
1,091
07
1,381
08
1,598
06 07 08
224 239 249
06 07 08
426 446 442
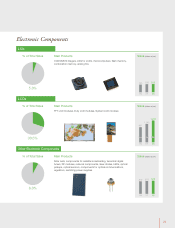
Notes: 1. Sales by product group include internal sales between segments (Consumer/Information Products and Electronic Components). Percentage of total sales
is calculated accordingly. The LSI group’s sales do not include internal sales to the LCD/Other Electronic Component group.
2. Effective for the year ended March 31, 2008, some items previously included in Other Electronic Components have been reclassified and are included in
LSIs. In this connection, sales by product group of 2007 has been restated to conform with the 2008 presentation.
39.4%
6.2%
10.9%
Audio-Visual and Communication Equipment
Home Appliances
Information Equipment