Sharp 2008 Annual Report Download - page 48
Download and view the complete annual report
Please find page 48 of the 2008 Sharp annual report below. You can navigate through the pages in the report by either clicking on the pages listed below, or by using the keyword search tool below to find specific information within the annual report.-
 1
1 -
2
-
3
-
4
-
5
-
6
-
7
-
8
-
9
-
10
-
11
-
12
-
13
-
14
-
15
-
16
-
17
-
18
-
19
-
20
-
21
-
22
-
23
-
24
-
25
-
26
-
27
-
28
-
29
-
30
-
31
-
32
-
33
-
34
-
35
-
36
-
37
-
 38
38 -
 39
39 -
 40
40 -
 41
41 -
 42
42 -
 43
43 -
 44
44 -
 45
45 -
 46
46 -
 47
47 -
 48
48 -
 49
49 -
 50
50 -
 51
51 -
 52
52 -
 53
53 -
 54
54 -
 55
55 -
 56
56 -
 57
57 -
 58
58 -
59
-
60
-
61
-
62
-
63
-
64
-
65
-
66
-
67
-
68
 |
 |

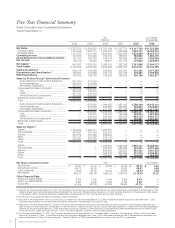
47 Sharp Annual Report 2008
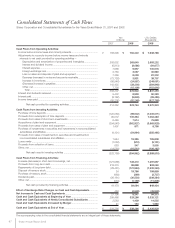
Consolidated Statements of Cash Flows
Sharp Corporation and Consolidated Subsidiaries for the Years Ended March 31, 2007 and 2008
Cash Flows from Operating Activities:
Income before income taxes and minority interests.......................................
Adjustments to reconcile income before income taxes and minority
interests to net cash provided by operating activities—
Depreciation and amortization of properties and intangibles....................
Interest and dividend income ..................................................................
Interest expense .....................................................................................
Foreign exchange loss ............................................................................
Loss on sales and disposal of plant and equipment ................................
Decrease (increase) in notes and accounts receivable.............................
Increase in inventories.............................................................................
(Decrease) increase in payables ..............................................................
Other, net ...............................................................................................
Total ....................................................................................................
Interest and dividends received.....................................................................
Interest paid..................................................................................................
Income taxes paid ........................................................................................
Net cash provided by operating activities ..........................................
Cash Flows from Investing Activities:
Purchase of time deposits ............................................................................
Proceeds from redemption of time deposits .................................................
Proceeds from sales of short-term investments ............................................
Acquisitions of plant and equipment .............................................................
Proceeds from sales of plant and equipment................................................
Purchase of investments in securities and investments in nonconsolidated
subsidiaries and affiliates ............................................................................
Proceeds from sales of investments in securities and investments in
nonconsolidated subsidiaries and affiliates..................................................
Loans made .................................................................................................
Proceeds from collection of loans.................................................................
Other, net .....................................................................................................
Net cash used in investing activities ..................................................
Cash Flows from Financing Activities:
Increase (decrease) in short-term borrowings, net ........................................
Proceeds from long-term debt......................................................................
Repayments of long-term debt .....................................................................
Disposal of treasury stock.............................................................................
Purchase of treasury stock ...........................................................................
Dividends paid..............................................................................................
Other, net .....................................................................................................
Net cash provided by financing activities...........................................
Effect of Exchange Rate Changes on Cash and Cash Equivalents............
Net Increase in Cash and Cash Equivalents ................................................
Cash and Cash Equivalents at Beginning of Year .......................................
Cash and Cash Equivalents of Newly Consolidated Subsidiaries ..............
Cash and Cash Equivalents Increased by Merger.......................................
Cash and Cash Equivalents at End of Year .................................................
$ 1,638,788
2,683,232
(81,677)
100,576
30,980
81,202
39,707
(248,051)
(284,848)
(152,616)
3,807,293
90,293
(99,485)
(527,758)
3,270,343
(1,005,071)
1,064,283
75,899
(3,665,929)
8,798
(555,495)
195,808
(5,151)
3,505
(106,162)
(3,989,515)
1,297,697
908,060
(1,232,263)
199,859
(3,727)
(308,384)
(11,808)
849,434
(45,949)
84,313
3,326,121
14,535
1,960
$ 3,426,929
¥ 162,240
265,640
(8,086)
9,957
3,067
8,039
3,931
(24,557)
(28,200)
(15,109)
376,922
8,939
(9,849)
(52,248)
323,764
(99,502)
105,364
7,514
(362,927)
871
(54,994)
19,385
(510)
347
(10,510)
(394,962)
128,472
89,898
(121,994)
19,786
(369)
(30,530)
(1,169)
84,094
(4,549)
8,347
329,286
1,439
194
¥ 339,266
¥ 158,295
208,632
(6,913)
7,668
2,760
7,356
(73,726)
(86,946)
143,425
7,756
368,307
9,432
(8,182)
(55,205)
314,352
(120,063)
95,072
6,480
(294,548)
1,407
(4,121)
1,944
(1,063)
683
(14,580)
(328,789)
(121,568)
218,370
(28,461)
24
(480)
(26,181)
(534)
41,170
463
27,196
299,466
2,583
41
¥ 329,286
The accompanying notes to the consolidated financial statements are an integral part of these statements.
2008
20082007
Yen
(millions) U.S. Dollars
(thousands)