Sharp 2008 Annual Report Download - page 41
Download and view the complete annual report
Please find page 41 of the 2008 Sharp annual report below. You can navigate through the pages in the report by either clicking on the pages listed below, or by using the keyword search tool below to find specific information within the annual report.-
 1
1 -
2
-
3
-
4
-
5
-
6
-
7
-
8
-
9
-
10
-
11
-
12
-
13
-
14
-
15
-
16
-
17
-
18
-
19
-
20
-
21
-
22
-
23
-
24
-
25
-
26
-
27
-
28
-
29
-
30
-
 31
31 -
 32
32 -
 33
33 -
 34
34 -
 35
35 -
 36
36 -
 37
37 -
 38
38 -
 39
39 -
 40
40 -
 41
41 -
 42
42 -
 43
43 -
 44
44 -
 45
45 -
 46
46 -
 47
47 -
 48
48 -
 49
49 -
 50
50 -
 51
51 -
52
-
53
-
54
-
55
-
56
-
57
-
58
-
59
-
60
-
61
-
62
-
63
-
64
-
65
-
66
-
67
-
68
 |
 |
40
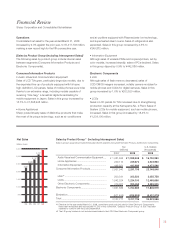
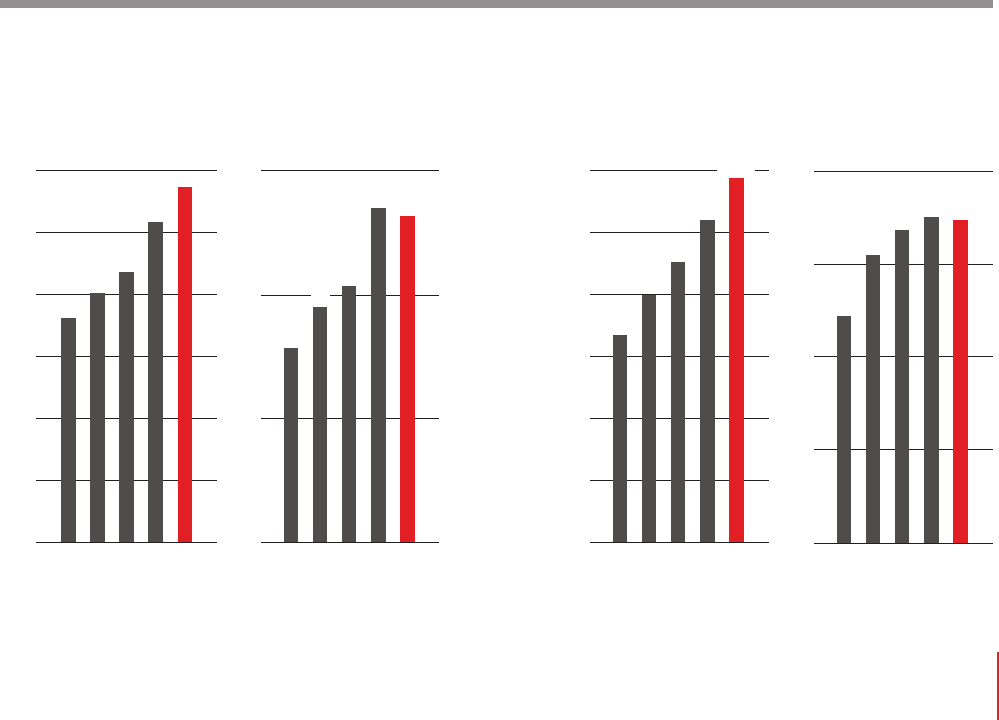
04 05 06 0807
0
30
60
90
81 79
47
57
62
04 05 06 0807
1,447
1,612
1,742
2,067
2,291
0
400
800
1,200
1,600
2,000
2,400
04 05 06 0807
1,561
1,004
1,197
1,358
0
300
600
900
1,200
1,500
1,800 1,762
04 05 06 0807
0
30
60
90
120
104
73
93
101
105
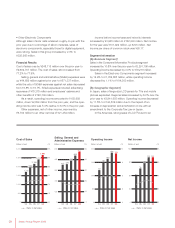
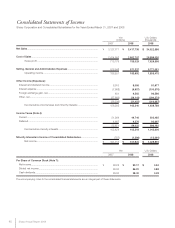
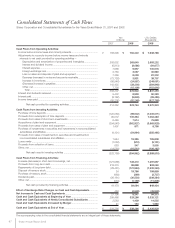
increase of 8.3% in regional sales to ¥577,912 million.
Operating income was down 21.9% at ¥7,444 million due
mainly to an increase in start-up costs for an LCD TV
production facility.
In Europe, sales of LCD TVs were robust, and sales of
CCD/CMOS imagers grew. Regional sales increased by
11.9% to ¥552,376 million and operating income increased
by 38.8% to ¥11,280 million.
In China, sales of LCD TVs were strong, while sales of
LCD panels for TVs and mobile equipment expanded.
Regional sales increased by 22.4% to ¥641,531 million.
Operating income was up 11.2% at ¥9,835 million.
In Other, sales of LCD TVs and large-size LCD panels for
TVs were brisk, while sales of refrigerators and air
conditioners expanded steadily. Overall sales were up 12.0%
to ¥380,428 million, and operating income climbed 74.1% to
¥3,683 million.
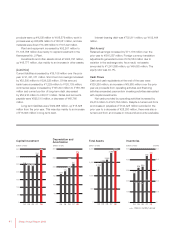
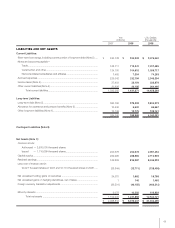
Capital Investment*and Depreciation
Capital investment for the fiscal year was ¥344,262 million, up
9.5% from the prior year. The majority of this was investment
to reinforce production lines at the Kameyama No. 2 Plant
aimed at providing a stable supply of large-size LCD panels,
to develop a new LCD panel plant planned for Sakai City,
Osaka Prefecture, and to strengthen production facilities at
foreign subsidiaries in the Americas and Europe.
The capital investment of Consumer/Information
Products was ¥45,976 million and of Electronic Components
was ¥298,286 million.
Depreciation and amortization increased by 27.0% to
¥276,567 million.
*The amount of properties for lease is included in capital investment.
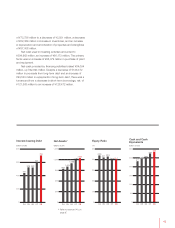
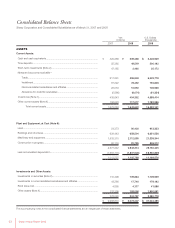
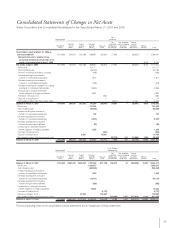
Assets, Liabilities and Net Assets
Total assets increased by ¥104,397 million over the prior year
to ¥3,073,207 million.
[Assets]
Current assets amounted to ¥1,642,622 million, a decrease of
¥36,641 million from the prior year. This was due mainly to a
decrease in short-term investments of ¥44,673 million to
¥2,492 million and a decrease in notes and accounts receivable
of ¥25,365 million to ¥679,916 million. Inventories totaled
¥454,352 million, up ¥18,709 million. Of this amount, finished
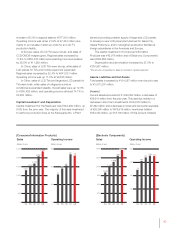
Operating IncomeSales Sales Operating Income
[Consumer/Information Products] [Electronic Components]
(billions of yen) (billions of yen) (billions of yen) (billions of yen)