Salesforce.com 2006 Annual Report Download - page 85
Download and view the complete annual report
Please find page 85 of the 2006 Salesforce.com annual report below. You can navigate through the pages in the report by either clicking on the pages listed below, or by using the keyword search tool below to find specific information within the annual report.-
 1
1 -
2
-
3
-
4
-
5
-
6
-
7
-
8
-
9
-
10
-
11
-
12
-
13
-
14
-
15
-
16
-
17
-
18
-
19
-
20
-
21
-
22
-
23
-
24
-
25
-
26
-
27
-
28
-
29
-
30
-
31
-
32
-
33
-
34
-
35
-
36
-
37
-
38
-
39
-
40
-
41
-
42
-
43
-
44
-
45
-
46
-
47
-
48
-
49
-
50
-
51
-
52
-
53
-
54
-
55
-
56
-
57
-
58
-
59
-
60
-
61
-
62
-
63
-
64
-
65
-
66
-
67
-
68
-
69
-
70
-
71
-
72
-
73
-
74
-
 75
75 -
 76
76 -
 77
77 -
 78
78 -
 79
79 -
 80
80 -
 81
81 -
 82
82 -
 83
83 -
 84
84 -
 85
85 -
 86
86 -
 87
87 -
 88
88 -
 89
89 -
 90
90 -
 91
91 -
 92
92 -
 93
93 -
 94
94 -
 95
95 -
96
-
97
-
98
-
99
-
100
-
101
-
102
-
103
-
104
-
105
-
106
-
107
-
108
-
109
-
110
-
111
-
112
-
113
-
114
-
115
-
116
-
117
-
118
-
119
-
120
-
121
-
122
-
123
-
124
 |
 |

Table of Contents
salesforce.com, inc.
Notes to Consolidated Financial Statements—(Continued)
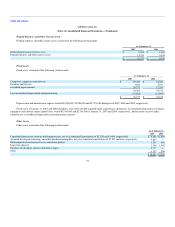
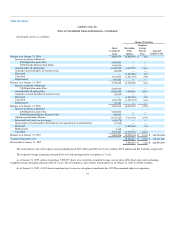
In addition to the resource sharing with the Foundation, the Company issued the Foundation warrants in August 2002 to purchase 500,000 shares of
common stock. Through January 31, 2007, the Foundation has exercised 375,000 of these warrants. Additionally, the Company has donated subscriptions to
the Company's service to other qualified non-profit organizations. The fair value of these donated subscriptions is in excess of $1.0 million per month. The
Company plans to continue providing free subscriptions to qualified non-profit organizations.
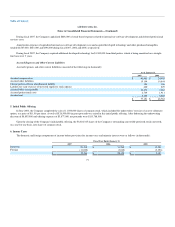
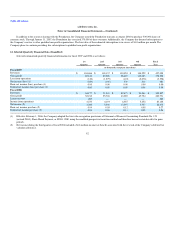
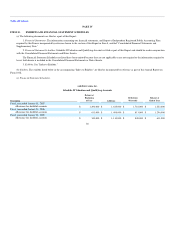
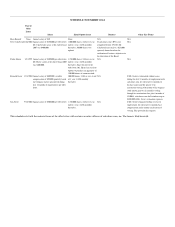
12. Selected Quarterly Financial Data (Unaudited)
Selected summarized quarterly financial information for fiscal 2007 and 2006 is as follows:
1st
Quarter
2nd
Quarter
3rd
Quarter
4th
Quarter
Fiscal
Year
(in thousands, except per share data)
Fiscal 2007
Revenues $ 104,686 $ 118,137 $ 130,053 $ 144,222 $ 497,098
Gross profit 80,126 89,006 98,693 110,383 378,208
Loss from operations (120) (1,279) (123) (2,076) (3,598)
Net income (loss) (1) (229) (145) 339 516 481
Basic net income (loss) per share (1) 0.00 0.00 0.00 0.00 0.00
Diluted net income (loss) per share (1) 0.00 0.00 0.00 0.00 0.00
Fiscal 2006
Revenues $ 64,177 $ 71,943 $ 82,673 $ 91,064 $ 309,857
Gross profit 52,212 55,706 63,089 69,724 240,731
Lease recovery 285 — — — 285
Income from operations 4,270 4,193 6,387 5,252 20,102
Net income (2) 4,380 5,040 13,097 5,957 28,474
Basic net income per share (2) 0.04 0.05 0.12 0.05 0.27
Diluted net income per share (2) 0.04 0.04 0.11 0.05 0.24
(1) Effective February 1, 2006, the Company adopted the fair value recognition provisions of Statement of Financial Accounting Standards No. 123
(revised 2004), Share-Based Payment, or SFAS 123R, using the modified prospective transition method and therefore has not restated results for prior
periods.
(2) Net income during the third quarter of fiscal 2006 included a $6.8 million income tax benefit associated with the reversal of the Company's deferred tax
valuation allowance.
82