Salesforce.com 2006 Annual Report Download - page 46
Download and view the complete annual report
Please find page 46 of the 2006 Salesforce.com annual report below. You can navigate through the pages in the report by either clicking on the pages listed below, or by using the keyword search tool below to find specific information within the annual report.-
 1
1 -
2
-
3
-
4
-
5
-
6
-
7
-
8
-
9
-
10
-
11
-
12
-
13
-
14
-
15
-
16
-
17
-
18
-
19
-
20
-
21
-
22
-
23
-
24
-
25
-
26
-
27
-
28
-
29
-
30
-
31
-
32
-
33
-
34
-
35
-
 36
36 -
 37
37 -
 38
38 -
 39
39 -
 40
40 -
 41
41 -
 42
42 -
 43
43 -
 44
44 -
 45
45 -
 46
46 -
 47
47 -
 48
48 -
 49
49 -
 50
50 -
 51
51 -
 52
52 -
 53
53 -
 54
54 -
 55
55 -
 56
56 -
57
-
58
-
59
-
60
-
61
-
62
-
63
-
64
-
65
-
66
-
67
-
68
-
69
-
70
-
71
-
72
-
73
-
74
-
75
-
76
-
77
-
78
-
79
-
80
-
81
-
82
-
83
-
84
-
85
-
86
-
87
-
88
-
89
-
90
-
91
-
92
-
93
-
94
-
95
-
96
-
97
-
98
-
99
-
100
-
101
-
102
-
103
-
104
-
105
-
106
-
107
-
108
-
109
-
110
-
111
-
112
-
113
-
114
-
115
-
116
-
117
-
118
-
119
-
120
-
121
-
122
-
123
-
124
 |
 |

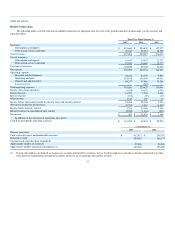
Table of Contents
Fiscal Year Ended January 31,
2007 2006 2005
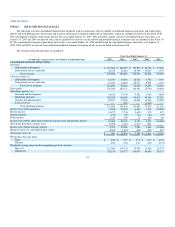
Revenues by geography:
Americas 78% 80% 80%
Europe 15 14 14
Asia Pacific 7 6 6
100% 100% 100%
Fiscal Year Ended January 31,
2007 2006 2005
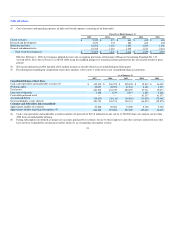
Stock-based expenses:
Cost of revenues 1% — % — %
Research and development 1 — —
Marketing and sales 4 1 1
General and administrative 2 — 1
8% 1% 2%
Overview of Fiscal Year Ended January 31, 2007
On February 1, 2006, we adopted the fair value recognition provisions of SFAS 123R, using the modified prospective transition method. The adoption
of this accounting pronouncement resulted in a significant reduction in our financial operating results. During fiscal 2007, our net income was $481,000,
which included $39.2 million of stock-based expenses, or 8 percent of total revenue. Net income during the same period a year ago was $28.5 million. Net
income during the year ended January 31, 2006 included a tax benefit of approximately $7.2 million which resulted from the reduction of our valuation
allowance for certain of our deferred tax assets. This determination was primarily based on our cumulative profitability over the past several quarters plus the
projected current and future taxable income that expected to be realized, particularly in specific tax jurisdictions such as the United States. The net income for
the year ended January 31, 2006 also included $3.4 million of stock-based expenses, or 1 percent of total revenue.
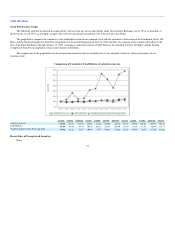
Revenues during fiscal 2007 were $497.1 million, an increase of 60 percent over the same period a year ago. The total number of paying subscriptions
increased to approximately 646,000 as of January 31, 2007 from approximately 393,000 as of January 31, 2006.
Our gross profit during fiscal 2007 was $378.2 million, or 76 percent of revenues, and included stock-based expenses of $5.5 million. Our operating
loss was $3.6 million and included stock-based expenses of $39.2 million. During the same period a year ago, we generated a gross profit of $240.7 million,
or 78 percent of revenues, and had operating income of $20.1 million. Operating income during the year ended January 31, 2006 also included $3.4 million of
stock-based expense.
Additionally, during fiscal 2007, we re-invested our revenue growth in an effort to expand our business. We incurred costs related to our data center
capacity and upgrading our development and test data center. Additionally, we added sales personnel to focus on adding new customers and increasing the
sale of subscriptions to existing customers, professional services personnel to support our consulting services, developers to broaden and enhance our on-
demand service and we invested in our infrastructure to meet the demands of an expanding business.
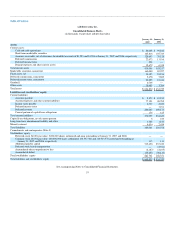
During fiscal 2007, we generated $111.2 million of cash from operating activities, as compared to $95.9 million during the same period a year ago. At
January 31, 2007, we had cash, cash equivalents and marketable securities of $412.5 million, as compared to $296.8 million at January 31, 2006, accounts
receivable of $128.7 million at January 31, 2007, as compared to $76.1 million at January 31, 2006, and deferred revenue of $284.1 million at January 31,
2007, as compared to $169.2 million at January 31, 2006.
43