Salesforce.com 2006 Annual Report Download - page 47
Download and view the complete annual report
Please find page 47 of the 2006 Salesforce.com annual report below. You can navigate through the pages in the report by either clicking on the pages listed below, or by using the keyword search tool below to find specific information within the annual report.-
 1
1 -
2
-
3
-
4
-
5
-
6
-
7
-
8
-
9
-
10
-
11
-
12
-
13
-
14
-
15
-
16
-
17
-
18
-
19
-
20
-
21
-
22
-
23
-
24
-
25
-
26
-
27
-
28
-
29
-
30
-
31
-
32
-
33
-
34
-
35
-
36
-
 37
37 -
 38
38 -
 39
39 -
 40
40 -
 41
41 -
 42
42 -
 43
43 -
 44
44 -
 45
45 -
 46
46 -
 47
47 -
 48
48 -
 49
49 -
 50
50 -
 51
51 -
 52
52 -
 53
53 -
 54
54 -
 55
55 -
 56
56 -
 57
57 -
58
-
59
-
60
-
61
-
62
-
63
-
64
-
65
-
66
-
67
-
68
-
69
-
70
-
71
-
72
-
73
-
74
-
75
-
76
-
77
-
78
-
79
-
80
-
81
-
82
-
83
-
84
-
85
-
86
-
87
-
88
-
89
-
90
-
91
-
92
-
93
-
94
-
95
-
96
-
97
-
98
-
99
-
100
-
101
-
102
-
103
-
104
-
105
-
106
-
107
-
108
-
109
-
110
-
111
-
112
-
113
-
114
-
115
-
116
-
117
-
118
-
119
-
120
-
121
-
122
-
123
-
124
 |
 |

Table of Contents
On April 10, 2006, we acquired 100 percent of the outstanding stock of Sendia Corporation, a privately-held on-demand wireless application company
based in Santa Monica, California, for $15.5 million in cash including acquisition costs. We believe Sendia's solution will provide our customers with the
increased ability to access on-demand applications via mobile handheld devices.
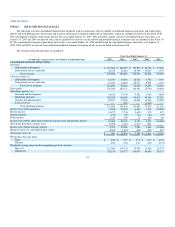
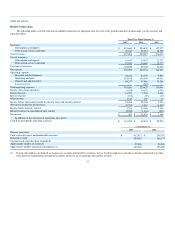
Fiscal Years Ended January 31, 2007 and 2006
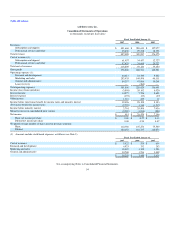
Revenues. Total revenues were $497.1 million for the year ended January 31, 2007, compared to $309.9 million during the same period a year ago, an
increase of $187.2 million, or 60 percent. Subscription and support revenues were $451.7 million, or 91 percent of total revenues, for the year ended
January 31, 2007, compared to $280.7 million, or 91 percent of total revenues, during the same period a year ago. The increase in subscription and support
revenues was due primarily to the increase in the number of paying subscriptions to approximately 646,000 as of January 31, 2007 from approximately
393,000 as of January 31, 2006. Professional services and other revenues were $45.4 million, or 9 percent of total revenues, for the year ended January 31,
2007, compared to $29.2 million, or 9 percent of total revenues, for the same period a year ago. The increase in professional services and other revenues was
due primarily to the higher demand for services from an increased number of paying subscriptions and customers.
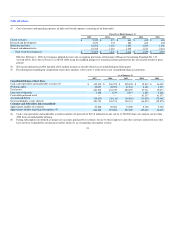
Revenues in Europe and Asia Pacific accounted for $109.5 million, or 22 percent of total revenues, during the year ended January 31, 2007, compared
to $62.8 million, or 20 percent of total revenues, during the same period a year ago, an increase of $46.7 million, or 74 percent. The increase in revenues
outside of the Americas was the result of our efforts to expand internationally.
Cost of Revenues. Cost of revenues was $118.9 million, or 24 percent of total revenues, during the year ended January 31, 2007, compared to $69.1
million, or 22 percent of total revenues, during the same period a year ago, an increase of $49.8 million. The increase in absolute dollars was primarily due to
an increase of $17.0 million in employee-related costs, primarily all of which was due to the 59 percent increase in the headcount of our professional services
organization since January 31, 2006, an increase of $4.9 million in stock-based expenses, an increase of $15.6 million in service delivery costs, primarily due
to our efforts in adding data center capacity, an increase of $3.9 million in depreciation and amortization expenses, an increase of $5.4 million in outside
subcontractor and other service costs and an increase of $2.1 million in allocated overhead. The cost of the additional professional services headcount resulted
in the cost of professional services and other revenues to be in excess of the related revenue during fiscal 2007 by $12.0 million. We increased the
professional services headcount in order to meet the current and anticipated demand for our consulting and training services as our subscriber base has
expanded and includes more large businesses and as we have expanded internationally.
We intend to continue to invest additional resources in our on-demand application service and in our capacity to deliver professional services. The
timing of these additional expenses, together with the requirement to expense stock options, will affect our cost of revenues, both in terms of absolute dollars
and as a percentage of revenues. We expect the cost of professional services and other revenue to continue to be in excess of the related revenue during fiscal
2008. We plan to make this investment since our professional services are designed to facilitate the adoption of our on-demand application service.
Research and Development. Research and development expenses were $44.6 million, or 9 percent of total revenues, during the year ended January 31,
2007, compared to $23.3 million, or 8 percent of total revenues, during the same period a year ago, an increase of $21.3 million. The increase in absolute
dollars was due to an increase of $12.0 million in employee-related costs, an increase of $4.2 million in stock-based expenses, an increase of $2.7 million in
depreciation expense, equipment and service costs and an increase of $2.4 million in allocated overhead. We increased our research and development
headcount by 84 percent since January 31, 2006 in order to upgrade and extend our service offerings and develop new technologies.
Marketing and Sales. Marketing and sales expenses were $252.9 million, or 51 percent of total revenues, during the year ended January 31, 2007,
compared to $149.6 million, or 48 percent of total revenues, during the
44