Salesforce.com 2006 Annual Report Download - page 38
Download and view the complete annual report
Please find page 38 of the 2006 Salesforce.com annual report below. You can navigate through the pages in the report by either clicking on the pages listed below, or by using the keyword search tool below to find specific information within the annual report.-
 1
1 -
2
-
3
-
4
-
5
-
6
-
7
-
8
-
9
-
10
-
11
-
12
-
13
-
14
-
15
-
16
-
17
-
18
-
19
-
20
-
21
-
22
-
23
-
24
-
25
-
26
-
27
-
 28
28 -
 29
29 -
 30
30 -
 31
31 -
 32
32 -
 33
33 -
 34
34 -
 35
35 -
 36
36 -
 37
37 -
 38
38 -
 39
39 -
 40
40 -
 41
41 -
 42
42 -
 43
43 -
 44
44 -
 45
45 -
 46
46 -
 47
47 -
 48
48 -
49
-
50
-
51
-
52
-
53
-
54
-
55
-
56
-
57
-
58
-
59
-
60
-
61
-
62
-
63
-
64
-
65
-
66
-
67
-
68
-
69
-
70
-
71
-
72
-
73
-
74
-
75
-
76
-
77
-
78
-
79
-
80
-
81
-
82
-
83
-
84
-
85
-
86
-
87
-
88
-
89
-
90
-
91
-
92
-
93
-
94
-
95
-
96
-
97
-
98
-
99
-
100
-
101
-
102
-
103
-
104
-
105
-
106
-
107
-
108
-
109
-
110
-
111
-
112
-
113
-
114
-
115
-
116
-
117
-
118
-
119
-
120
-
121
-
122
-
123
-
124
 |
 |

Table of Contents
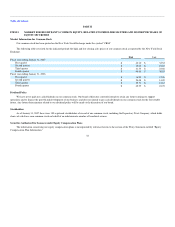
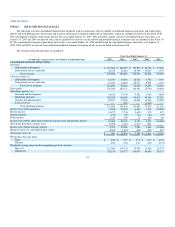
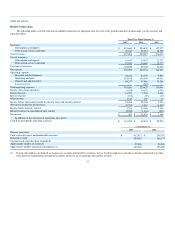
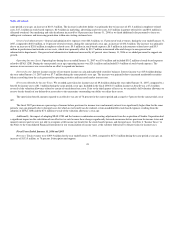
(1) Cost of revenues and operating expenses include stock-based expenses, consisting of (in thousands):
Fiscal Year Ended January 31,
2007 2006 2005 2004 2003
Cost of revenues $ 5,522 $ 575 $ 634 $ 655 $ 428
Research and development 4,523 332 282 462 402
Marketing and sales 18,392 1,325 1,296 2,029 1,696
General and administrative 10,768 1,216 1,402 1,213 2,241
Total stock-based expenses $ 39,205 $ 3,448 $ 3,614 $ 4,359 $ 4,767
Effective February 1, 2006, the Company adopted the fair value recognition provisions of Statement of Financial Accounting Standards No. 123
(revised 2004), Share-Based Payment, or SFAS 123R, using the modified prospective transition method and therefore has not restated results for prior
periods.
(2) Net income during fiscal 2006 included a $6.8 million income tax benefit which was recorded during the third quarter.
(3) For information regarding the computation of per share amounts, refer to note 1 of the notes to our consolidated financial statements.
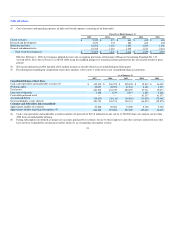
As of January 31,
2007 2006 2005 2004 2003
Consolidated Balance Sheet Data:
Cash, cash equivalents and marketable securities (4) $ 412,512 $ 296,792 $ 205,938 $ 35,812 $ 16,009
Working capital 42,097 68,592 47,044 4,140 1,172
Total assets 664,832 434,749 280,499 87,511 39,673
Long-term obligations 1,408 1,339 2,317 1,830 5,206
Convertible preferred stock — — — 61,137 61,137
Accumulated deficit (35,633) (36,114) (64,588) (71,934) (75,448)
Total stockholders' equity (deficit) 281,791 196,371 145,131 (46,237) (55,875)
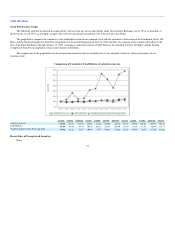
Customer and Subscriber Data (unaudited):
Approximate number of customers 29,800 20,500 13,900 8,700 5,700
Approximate number of paying subscriptions (5) 646,000 393,000 227,000 127,000 76,000
(4) Cash, cash equivalents and marketable securities includes net proceeds of $113.8 million from our sale of 11,500,000 shares of common stock in June
2004 from our initial public offering.
(5) Paying subscriptions are defined as unique user accounts, purchased by customers for use by their employees and other customer-authorized users that
have not been suspended for non-payment and for which we are recognizing subscription revenue.
35