Salesforce.com 2006 Annual Report Download - page 44
Download and view the complete annual report
Please find page 44 of the 2006 Salesforce.com annual report below. You can navigate through the pages in the report by either clicking on the pages listed below, or by using the keyword search tool below to find specific information within the annual report.-
 1
1 -
2
-
3
-
4
-
5
-
6
-
7
-
8
-
9
-
10
-
11
-
12
-
13
-
14
-
15
-
16
-
17
-
18
-
19
-
20
-
21
-
22
-
23
-
24
-
25
-
26
-
27
-
28
-
29
-
30
-
31
-
32
-
33
-
 34
34 -
 35
35 -
 36
36 -
 37
37 -
 38
38 -
 39
39 -
 40
40 -
 41
41 -
 42
42 -
 43
43 -
 44
44 -
 45
45 -
 46
46 -
 47
47 -
 48
48 -
 49
49 -
 50
50 -
 51
51 -
 52
52 -
 53
53 -
 54
54 -
55
-
56
-
57
-
58
-
59
-
60
-
61
-
62
-
63
-
64
-
65
-
66
-
67
-
68
-
69
-
70
-
71
-
72
-
73
-
74
-
75
-
76
-
77
-
78
-
79
-
80
-
81
-
82
-
83
-
84
-
85
-
86
-
87
-
88
-
89
-
90
-
91
-
92
-
93
-
94
-
95
-
96
-
97
-
98
-
99
-
100
-
101
-
102
-
103
-
104
-
105
-
106
-
107
-
108
-
109
-
110
-
111
-
112
-
113
-
114
-
115
-
116
-
117
-
118
-
119
-
120
-
121
-
122
-
123
-
124
 |
 |

Table of Contents
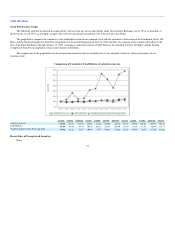
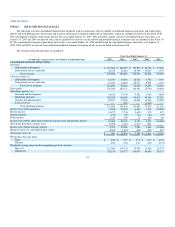
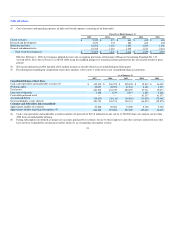
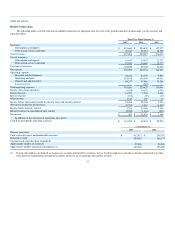
Results of Operations
The following tables set forth selected consolidated statements of operations data for each of the periods indicated (in thousands, except customer and
subscriber data).
Fiscal Year Ended January 31,
2007 2006 2005
Revenues:
Subscription and support $ 451,660 $ 280,639 $ 157,977
Professional services and other 45,438 29,218 18,398
Total revenues 497,098 309,857 176,375
Cost of revenues:
Subscription and support 61,457 34,457 12,727
Professional services and other 57,433 34,669 20,727
Total cost of revenues 118,890 69,126 33,454
Gross profit 378,208 240,731 142,921
Operating expenses:
Research and development 44,614 23,330 9,822
Marketing and sales 252,935 149,598 96,311
General and administrative 84,257 47,986 30,268
Lease recovery — (285) —
Total operating expenses 381,806 220,629 136,401
Income (loss) from operations (3,598) 20,102 6,520
Interest income 14,977 7,726 2,658
Interest expense (193) (69) (37)
Other income 1,310 439 12
Income before (provision) benefit for income taxes and minority interest 12,496 28,198 9,153
(Provision) benefit for income taxes (9,795) 1,310 (1,217)
Income before minority interest 2,701 29,508 7,936
Minority interest in consolidated joint venture (2,220) (1,034) (590)
Net income $ 481 $ 28,474 $ 7,346
In addition to the statement of operations data above:
Cash flow provided by operating activities $ 111,224 $ 95,893 $ 55,872
As of January 31,
2007 2006
Balance sheet data:
Cash, cash equivalents and marketable securities $ 412,512 $ 296,792
Deferred revenue 284,063 169,175
Customer and subscriber data (unaudited):
Approximate number of customers 29,800 20,500
Approximate number of paying subscriptions (1) 646,000 393,000
(1) Paying subscriptions are defined as unique user accounts, purchased by customers for use by their employees and other customer-authorized users that
have not been suspended for non-payment and for which we are recognizing subscription revenue.
41