Salesforce.com 2006 Annual Report Download - page 57
Download and view the complete annual report
Please find page 57 of the 2006 Salesforce.com annual report below. You can navigate through the pages in the report by either clicking on the pages listed below, or by using the keyword search tool below to find specific information within the annual report.-
 1
1 -
2
-
3
-
4
-
5
-
6
-
7
-
8
-
9
-
10
-
11
-
12
-
13
-
14
-
15
-
16
-
17
-
18
-
19
-
20
-
21
-
22
-
23
-
24
-
25
-
26
-
27
-
28
-
29
-
30
-
31
-
32
-
33
-
34
-
35
-
36
-
37
-
38
-
39
-
40
-
41
-
42
-
43
-
44
-
45
-
46
-
 47
47 -
 48
48 -
 49
49 -
 50
50 -
 51
51 -
 52
52 -
 53
53 -
 54
54 -
 55
55 -
 56
56 -
 57
57 -
 58
58 -
 59
59 -
 60
60 -
 61
61 -
 62
62 -
 63
63 -
 64
64 -
 65
65 -
 66
66 -
 67
67 -
68
-
69
-
70
-
71
-
72
-
73
-
74
-
75
-
76
-
77
-
78
-
79
-
80
-
81
-
82
-
83
-
84
-
85
-
86
-
87
-
88
-
89
-
90
-
91
-
92
-
93
-
94
-
95
-
96
-
97
-
98
-
99
-
100
-
101
-
102
-
103
-
104
-
105
-
106
-
107
-
108
-
109
-
110
-
111
-
112
-
113
-
114
-
115
-
116
-
117
-
118
-
119
-
120
-
121
-
122
-
123
-
124
 |
 |

Table of Contents
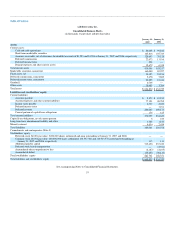
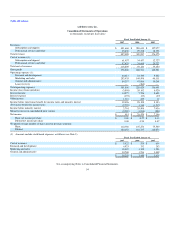
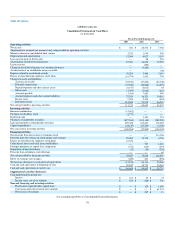
salesforce.com, inc.
Consolidated Statements of Operations
(in thousands, except per share data)
Fiscal Year Ended January 31,
2007 2006 2005
Revenues:
Subscription and support $ 451,660 $ 280,639 $ 157,977
Professional services and other 45,438 29,218 18,398
Total revenues 497,098 309,857 176,375
Cost of revenues (1):
Subscription and support 61,457 34,457 12,727
Professional services and other 57,433 34,669 20,727
Total cost of revenues 118,890 69,126 33,454
Gross profit 378,208 240,731 142,921
Operating expenses (1):
Research and development 44,614 23,330 9,822
Marketing and sales 252,935 149,598 96,311
General and administrative 84,257 47,986 30,268
Lease recovery — (285) —
Total operating expenses 381,806 220,629 136,401
Income (loss) from operations (3,598) 20,102 6,520
Interest income 14,977 7,726 2,658
Interest expense (193) (69) (37)
Other income 1,310 439 12
Income before (provision) benefit for income taxes and minority interest 12,496 28,198 9,153
(Provision) benefit for income taxes (9,795) 1,310 (1,217)
Income before minority interest 2,701 29,508 7,936
Minority interest in consolidated joint venture (2,220) (1,034) (590)
Net income $ 481 $ 28,474 $ 7,346
Basic net income per share $ 0.00 $ 0.27 $ 0.10
Diluted net income per share 0.00 0.24 0.07
Weighted-average number of shares used in per share amounts:
Basic 112,386 107,274 75,503
Diluted 120,154 118,737 110,874
(1) Amounts include stock-based expenses, as follows (see Note 1):
Fiscal Year Ended January 31,
2007 2006 2005
Cost of revenues $ 5,522 $ 575 $ 634
Research and development 4,523 332 282
Marketing and sales 18,392 1,325 1,296
General and administrative 10,768 1,216 1,402
$ 39,205 $ 3,448 $ 3,614
See accompanying Notes to Consolidated Financial Statements.
54