Salesforce.com 2006 Annual Report Download - page 49
Download and view the complete annual report
Please find page 49 of the 2006 Salesforce.com annual report below. You can navigate through the pages in the report by either clicking on the pages listed below, or by using the keyword search tool below to find specific information within the annual report.-
 1
1 -
2
-
3
-
4
-
5
-
6
-
7
-
8
-
9
-
10
-
11
-
12
-
13
-
14
-
15
-
16
-
17
-
18
-
19
-
20
-
21
-
22
-
23
-
24
-
25
-
26
-
27
-
28
-
29
-
30
-
31
-
32
-
33
-
34
-
35
-
36
-
37
-
38
-
 39
39 -
 40
40 -
 41
41 -
 42
42 -
 43
43 -
 44
44 -
 45
45 -
 46
46 -
 47
47 -
 48
48 -
 49
49 -
 50
50 -
 51
51 -
 52
52 -
 53
53 -
 54
54 -
 55
55 -
 56
56 -
 57
57 -
 58
58 -
 59
59 -
60
-
61
-
62
-
63
-
64
-
65
-
66
-
67
-
68
-
69
-
70
-
71
-
72
-
73
-
74
-
75
-
76
-
77
-
78
-
79
-
80
-
81
-
82
-
83
-
84
-
85
-
86
-
87
-
88
-
89
-
90
-
91
-
92
-
93
-
94
-
95
-
96
-
97
-
98
-
99
-
100
-
101
-
102
-
103
-
104
-
105
-
106
-
107
-
108
-
109
-
110
-
111
-
112
-
113
-
114
-
115
-
116
-
117
-
118
-
119
-
120
-
121
-
122
-
123
-
124
 |
 |

Table of Contents
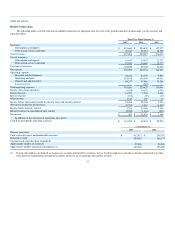
revenues were $280.7 million, or 91 percent of total revenues, for the year ended January 31, 2006, compared to $158.0 million, or 90 percent of total
revenues, during the same period a year ago. The increase in subscription and support revenues was due primarily to the increase in the number of paying
subscribers to approximately 393,000 as of January 31, 2006 from approximately 227,000 as of January 31, 2005. Professional services and other revenues
were $29.2 million, or 9 percent of total revenues, for the year ended January 31, 2006, compared to $18.4 million, or 10 percent of total revenues, for the
same period a year ago. The increase in professional services and other revenues was due primarily to the higher demand for services from an increased
number of paying subscribers and customers.
Revenues in Europe and Asia Pacific accounted for $62.8 million, or 20 percent of total revenues, during the year ended January 31, 2006, compared to
$35.5 million, or 20 percent of total revenues, during the same period a year ago, an increase of $27.3 million, or 77 percent. The increase in revenues outside
of the Americas was the result of our efforts to expand internationally.
Cost of Revenues. Cost of revenues was $69.1 million, or 22 percent of total revenues, during the year ended January 31, 2006, compared to $33.5
million, or 19 percent of total revenues, during the same period a year ago, an increase of $35.6 million. The increase in absolute dollars was primarily due to
an increase of $14.6 million in employee-related costs, primarily all of which was due to the 60 percent increase in the headcount of our professional services
organization since January 31, 2005, an increase of $11.6 million in service delivery costs, primarily due to our efforts in adding data center capacity, an
increase of $1.5 million in depreciation and amortization expenses, an increase of $3.3 million in outside subcontractor and other service costs and an increase
of $4.3 million in allocated overhead charges. The cost of the additional professional services headcount resulted in the cost of professional services and other
revenues to be in excess of the related revenue during the year ended January 31, 2006 by $5.5 million. We increased the professional services headcount in
order to meet the anticipated demand for our consulting and training services as our subscriber base has expanded.
Research and Development. Research and development expenses were $23.3 million, or 8 percent of total revenues, during the year ended January 31,
2006, compared to $9.8 million, or 5 percent of total revenues, during the same period a year ago, an increase of $13.5 million. The increase in absolute
dollars was primarily due to an increase of $7.7 million in employee-related costs, an increase of $3.6 million in equipment and service costs primarily due to
upgrading our new development and test data center and a $1.6 million increase in allocated overhead charges. We increased our research and development
headcount by 77 percent since January 31, 2005 in order to upgrade and extend our service offerings and develop new technologies. During the year ended
January 31, 2006, we capitalized $1.4 million in development costs associated with planned releases of our application service.
Marketing and Sales. Marketing and sales expenses were $149.6 million, or 48 percent of total revenues, during the year ended January 31, 2006,
compared to $96.3 million, or 55 percent of total revenues, during the same period a year ago, an increase of $53.3 million. The increase in absolute dollars
was primarily due to an increase of $37.9 million in employee-related costs, $5.0 million in marketing spending related to new service offerings, advertising
and events and a $9.1 million increase in allocated overhead. Our marketing and sales headcount increased by 72 percent since January 31, 2005 as we hired
additional sales personnel to focus on adding new customers and increasing penetration within our existing customer base.
General and Administrative. General and administrative expenses were $48.0 million, or 16 percent of total revenues, during the year ended January 31,
2006, compared to $30.3 million, or 17 percent of total revenues, during the same period a year ago, an increase of $17.7 million. The increase was primarily
due to an increase of $22.2 million in employee-related costs, $4.1 million in professional and outside service costs and $4.5 million in infrastructure-related
costs, which were offset by $15.0 million in increased allocated charges to non-general and administrative departments. Our general and administrative
headcount increased by 69 percent since January 31, 2005 as we added personnel to support our growth.
46