Salesforce.com 2006 Annual Report Download - page 68
Download and view the complete annual report
Please find page 68 of the 2006 Salesforce.com annual report below. You can navigate through the pages in the report by either clicking on the pages listed below, or by using the keyword search tool below to find specific information within the annual report.-
 1
1 -
2
-
3
-
4
-
5
-
6
-
7
-
8
-
9
-
10
-
11
-
12
-
13
-
14
-
15
-
16
-
17
-
18
-
19
-
20
-
21
-
22
-
23
-
24
-
25
-
26
-
27
-
28
-
29
-
30
-
31
-
32
-
33
-
34
-
35
-
36
-
37
-
38
-
39
-
40
-
41
-
42
-
43
-
44
-
45
-
46
-
47
-
48
-
49
-
50
-
51
-
52
-
53
-
54
-
55
-
56
-
57
-
 58
58 -
 59
59 -
 60
60 -
 61
61 -
 62
62 -
 63
63 -
 64
64 -
 65
65 -
 66
66 -
 67
67 -
 68
68 -
 69
69 -
 70
70 -
 71
71 -
 72
72 -
 73
73 -
 74
74 -
 75
75 -
 76
76 -
 77
77 -
 78
78 -
79
-
80
-
81
-
82
-
83
-
84
-
85
-
86
-
87
-
88
-
89
-
90
-
91
-
92
-
93
-
94
-
95
-
96
-
97
-
98
-
99
-
100
-
101
-
102
-
103
-
104
-
105
-
106
-
107
-
108
-
109
-
110
-
111
-
112
-
113
-
114
-
115
-
116
-
117
-
118
-
119
-
120
-
121
-
122
-
123
-
124
 |
 |

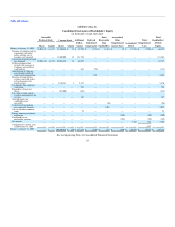
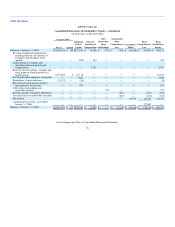
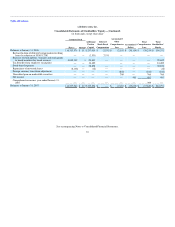
Table of Contents
salesforce.com, inc.
Notes to Consolidated Financial Statements—(Continued)
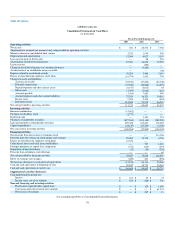
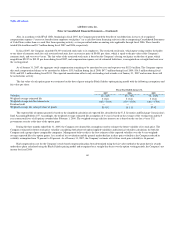
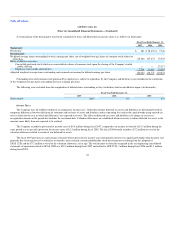
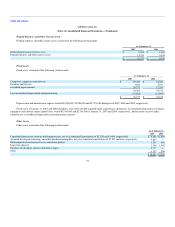
A reconciliation of the denominator used in the calculation of basic and diluted net income per share is as follows (in thousands):
Fiscal Year Ended January 31,
2007 2006 2005
Numerator:
Net income $ 481 $ 28,474 $ 7,346
Denominator:
Weighted-average shares outstanding for basic earnings per share, net of weighted-average shares of common stock subject to
repurchase 112,386 107,274 75,503
Effect of dilutive securities:
Convertible preferred stock which was converted into shares of common stock upon the closing of the Company's initial
public offering — — 22,317
Employee stock awards and warrants 7,768 11,463 13,054
Adjusted weighted-average shares outstanding and assumed conversions for diluted earnings per share 120,154 118,737 110,874
Outstanding unvested common stock purchased by employees is subject to repurchase by the Company and therefore is not included in the calculation
of the weighted-average shares outstanding for basic earnings per share.
The following were excluded from the computation of diluted shares outstanding as they would have had an anti-dilutive impact (in thousands):
Fiscal Year Ended January 31,
2007 2006 2005
Stock awards 4,019 387 674
Income Taxes
The Company uses the liability method of accounting for income taxes. Under this method, deferred tax assets and liabilities are determined based on
temporary differences between the financial statement and tax basis of assets and liabilities and net operating loss and credit carryforwards using enacted tax
rates in effect for the year in which the differences are expected to reverse. The effect on deferred tax assets and liabilities of a change in tax rates is
recognized in income in the period that includes the enactment date. Valuation allowances are established when necessary to reduce deferred tax assets to the
amounts more likely than not expected to be realized.
The Company recorded a provision for income taxes of $9.8 million during fiscal 2007, compared to an income tax benefit of $1.3 million during the
same period a year ago and a provision for income taxes of $1.2 million during fiscal 2005. The fiscal 2006 benefit includes a $7.2 million reversal of the
valuation allowance related to certain of our deferred tax assets.
The fiscal 2007 provision as a percentage of income before provision for income taxes and minority interest was significantly higher than the prior year
primarily due to foreign losses for which no tax benefit can be realized, certain nondeductible stock-based expenses resulting from the adoption of
SFAS 123R and the $7.2 million reversal of the valuation allowance a year ago. The total income tax benefit recognized in the accompanying consolidated
statements of operations related to SFAS 123R was $12.4 million during fiscal 2007 and related to APB 25 $1.3 million during fiscal 2006 and $1.3 million
during fiscal 2005.
65