Rite Aid 2011 Annual Report Download - page 75
Download and view the complete annual report
Please find page 75 of the 2011 Rite Aid annual report below. You can navigate through the pages in the report by either clicking on the pages listed below, or by using the keyword search tool below to find specific information within the annual report.-
 1
1 -
2
-
3
-
4
-
5
-
6
-
7
-
8
-
9
-
10
-
11
-
12
-
13
-
14
-
15
-
16
-
17
-
18
-
19
-
20
-
21
-
22
-
23
-
24
-
25
-
26
-
27
-
28
-
29
-
30
-
31
-
32
-
33
-
34
-
35
-
36
-
37
-
38
-
39
-
40
-
41
-
42
-
43
-
44
-
45
-
46
-
47
-
48
-
49
-
50
-
51
-
52
-
53
-
54
-
55
-
56
-
57
-
58
-
59
-
60
-
61
-
62
-
63
-
64
-
 65
65 -
 66
66 -
 67
67 -
 68
68 -
 69
69 -
 70
70 -
 71
71 -
 72
72 -
 73
73 -
 74
74 -
 75
75 -
 76
76 -
 77
77 -
 78
78 -
 79
79 -
 80
80 -
 81
81 -
 82
82 -
 83
83 -
 84
84 -
 85
85 -
86
-
87
-
88
-
89
-
90
-
91
-
92
-
93
-
94
-
95
-
96
-
97
-
98
-
99
-
100
-
101
-
102
-
103
-
104
-
105
-
106
-
107
-
108
-
109
-
110
-
111
-
112
-
113
-
114
-
115
-
116
-
117
-
118
-
119
 |
 |

RITE AID CORPORATION AND SUBSIDIARIES
NOTES TO CONSOLIDATED FINANCIAL STATEMENTS (Continued)
For the Years Ended February 26, 2011, February 27, 2010 and February 28, 2009
(In thousands, except per share amounts)
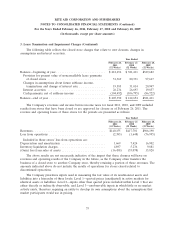
3. Lease Termination and Impairment Charges (Continued)
The following table reflects the closed store charges that relate to new closures, changes in
assumptions and interest accretion.
Year Ended
February 26, February 27, February 28,
2011 2010 2009
(52 Weeks) (52 Weeks) (52 Weeks)
Balance—beginning of year ............................ $412,654 $ 381,411 $329,682
Provision for present value of noncancellable lease payments
of closed stores ................................. 51,369 80,331 97,667
Changes in assumptions about future sublease income,
terminations and change of interest rate ............... 19,585 31,014 20,947
Interest accretion ................................. 26,234 26,693 19,837
Cash payments, net of sublease income ................. (104,492) (106,795) (86,722)
Balance—end of year ................................ $405,350 $ 412,654 $381,411
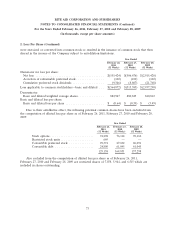
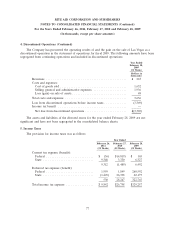
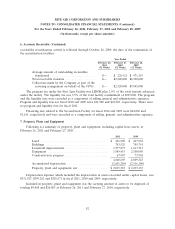
The Company’s revenues and income before income taxes for fiscal 2011, 2010, and 2009 included
results from stores that have been closed or are approved for closure as of February 26, 2011. The
revenue and operating losses of these stores for the periods are presented as follows:
Year Ended
February 26, February 27, February 28,
2011 2010 2009
(52 Weeks) (52 Weeks) (52 Weeks)
Revenues ......................................... $140,155 $417,701 $966,190
Loss from operations ................................ (2,385) (1,648) (76,995)
Included in these stores’ loss from operations are:
Depreciation and amortization ......................... 1,669 7,424 16,902
Inventory liquidation charges ........................... 4,897 5,236 9,881
(Gain) loss from sales of assets ......................... (16,458) (33,078) 13,820
The above results are not necessarily indicative of the impact that these closures will have on
revenues and operating results of the Company in the future, as the Company often transfers the
business of a closed store to another Company store, thereby retaining a portion of these revenues. The
amounts indicated above do not include the results of operations for stores closed related to
discontinued operations.
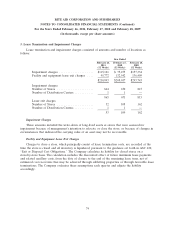
The Company prioritizes inputs used in measuring the fair value of its nonfinancial assets and
liabilities into a hierarchy of three levels: Level 1—quoted prices (unadjusted) in active markets for
identical assets or liabilities; Level 2—inputs other than quoted prices included within Level 1 that are
either directly or indirectly observable; and Level 3—unobservable inputs in which little or no market
activity exists, therefore requiring an entity to develop its own assumptions about the assumptions that
market participants would use in pricing.
75