Rite Aid 2011 Annual Report Download - page 71
Download and view the complete annual report
Please find page 71 of the 2011 Rite Aid annual report below. You can navigate through the pages in the report by either clicking on the pages listed below, or by using the keyword search tool below to find specific information within the annual report.-
 1
1 -
2
-
3
-
4
-
5
-
6
-
7
-
8
-
9
-
10
-
11
-
12
-
13
-
14
-
15
-
16
-
17
-
18
-
19
-
20
-
21
-
22
-
23
-
24
-
25
-
26
-
27
-
28
-
29
-
30
-
31
-
32
-
33
-
34
-
35
-
36
-
37
-
38
-
39
-
40
-
41
-
42
-
43
-
44
-
45
-
46
-
47
-
48
-
49
-
50
-
51
-
52
-
53
-
54
-
55
-
56
-
57
-
58
-
59
-
60
-
 61
61 -
 62
62 -
 63
63 -
 64
64 -
 65
65 -
 66
66 -
 67
67 -
 68
68 -
 69
69 -
 70
70 -
 71
71 -
 72
72 -
 73
73 -
 74
74 -
 75
75 -
 76
76 -
 77
77 -
 78
78 -
 79
79 -
 80
80 -
 81
81 -
82
-
83
-
84
-
85
-
86
-
87
-
88
-
89
-
90
-
91
-
92
-
93
-
94
-
95
-
96
-
97
-
98
-
99
-
100
-
101
-
102
-
103
-
104
-
105
-
106
-
107
-
108
-
109
-
110
-
111
-
112
-
113
-
114
-
115
-
116
-
117
-
118
-
119
 |
 |
RITE AID CORPORATION AND SUBSIDIARIES
NOTES TO CONSOLIDATED FINANCIAL STATEMENTS (Continued)
For the Years Ended February 26, 2011, February 27, 2010 and February 28, 2009
(In thousands, except per share amounts)
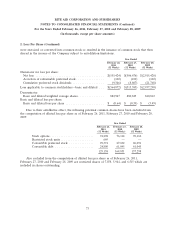
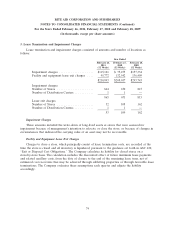
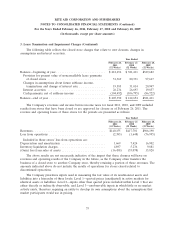
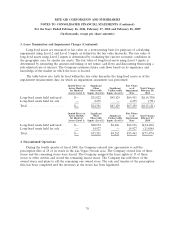
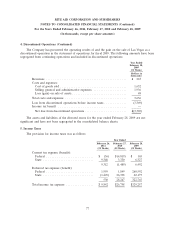
1. Summary of Significant Accounting Policies (Continued)
information not previously available. Due to the complexity of some of these uncertainties, the ultimate
resolution may result in a payment that is materially different from the current estimate of the tax
liabilities.
Sales Tax Collected
Sales taxes collected from customers and remitted to various governmental agencies are presented
on a net basis (excluded from revenues) in the Company’s statement of operations.
Use of Estimates
The preparation of the financial statements in conformity with accounting principles generally
accepted in the United States of America requires management to make estimates and assumptions
that affect the amounts reported in the financial statements and accompanying notes. Actual results
could differ from those estimates.
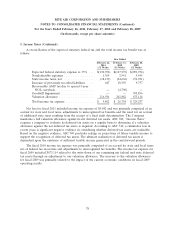
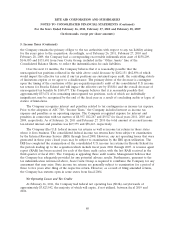
Significant Concentrations
The Company’s pharmacy sales were primarily to customers covered by health plan contracts,
which typically contract with a third party payor that agrees to pay for all or a portion of a customer’s
eligible prescription purchases. During fiscal 2011, the top five third party payors accounted for
approximately 60.9% of the Company’s pharmacy sales. The largest third party payor represented
23.8%, 21.2%, and 18.7% of pharmacy sales during fiscal 2011, 2010, and 2009, respectively. Third
party payors are entities such as an insurance company, governmental agency, health maintenance
organization or other managed care provider, and typically represent several health care contracts and
customers. During fiscal 2011, state sponsored Medicaid agencies accounted for approximately 11.5% of
the Company’s pharmacy sales, the largest of which was approximately 3.1% of the Company’s
pharmacy sales. During fiscal 2011, approximately 27.0% of the Company’s pharmacy sales were to
customers covered by Medicare Part D. Any significant loss of third-party payor business could have a
material adverse effect on the Company’s business and results of operations.
During fiscal 2011, the Company purchased brand pharmaceuticals and some generic
pharmaceuticals which amounted to approximately 91.4% of the dollar volume of its prescription drugs
from a single wholesaler, McKesson Corp. (‘‘McKesson’’), under a contract expiring April 1, 2013. With
limited exceptions, the Company is required to purchase all of its branded pharmaceutical products
from McKesson. If the Company’s relationship with McKesson was disrupted, the Company could have
temporary difficulty filling prescriptions for brand named drugs until a replacement wholesaler
agreement was executed, which would negatively impact the business. The Company purchases almost
all of its generic (non-brand name) pharmaceuticals directly from manufactures which account for
approximately 76% of its prescription volume. The loss of any one of the generic suppliers would not
disrupt the Company’s ability to fill generic (non-brand name) prescriptions but could negatively impact
the Company’s results.
71