Rite Aid 2011 Annual Report Download - page 29
Download and view the complete annual report
Please find page 29 of the 2011 Rite Aid annual report below. You can navigate through the pages in the report by either clicking on the pages listed below, or by using the keyword search tool below to find specific information within the annual report.-
 1
1 -
2
-
3
-
4
-
5
-
6
-
7
-
8
-
9
-
10
-
11
-
12
-
13
-
14
-
15
-
16
-
17
-
18
-
 19
19 -
 20
20 -
 21
21 -
 22
22 -
 23
23 -
 24
24 -
 25
25 -
 26
26 -
 27
27 -
 28
28 -
 29
29 -
 30
30 -
 31
31 -
 32
32 -
 33
33 -
 34
34 -
 35
35 -
 36
36 -
 37
37 -
 38
38 -
 39
39 -
40
-
41
-
42
-
43
-
44
-
45
-
46
-
47
-
48
-
49
-
50
-
51
-
52
-
53
-
54
-
55
-
56
-
57
-
58
-
59
-
60
-
61
-
62
-
63
-
64
-
65
-
66
-
67
-
68
-
69
-
70
-
71
-
72
-
73
-
74
-
75
-
76
-
77
-
78
-
79
-
80
-
81
-
82
-
83
-
84
-
85
-
86
-
87
-
88
-
89
-
90
-
91
-
92
-
93
-
94
-
95
-
96
-
97
-
98
-
99
-
100
-
101
-
102
-
103
-
104
-
105
-
106
-
107
-
108
-
109
-
110
-
111
-
112
-
113
-
114
-
115
-
116
-
117
-
118
-
119
 |
 |

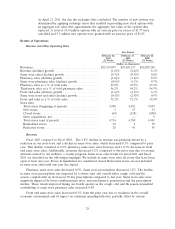
management initiatives, such as our wellness+ loyalty card program. The trend improved during our
fourth quarter due largely to the later cough, cold and flu season and our wellness+ loyalty card
program, which resulted in a front-end same store sales increase of 1.0% compared to the fourth
quarter last year.
Fiscal 2010 compared to Fiscal 2009: The 2.4% decline in revenue was primarily driven by a
reduction in our store base and a decline in same store sales, which decreased 0.9% compared to prior
year. This decline consisted of 0.1% pharmacy same store sales increase offset by a 2.9% decrease in
front end same store sales.
Pharmacy same store sales increased 0.1%. Same store prescription growth was 0.8% for fiscal
2010, which was positively impacted by the growth of our Rx Savings Card, a strong flu season and
growth in our automated refill reminder program and other prescription compliance programs. The
impact on sales of the increase in our prescription count was partially offset by an increase in generic
sales and reductions in pharmacy reimbursement rates.
Front end same store sales decreased 2.9% from the prior year, due to weakness in the overall
economic environment and its impact on consumer shopping behavior and the impact of some of our
initiatives, including our efforts to reduce costs, to reduce inventory, and to make changes to operating
procedures for low volume stores.
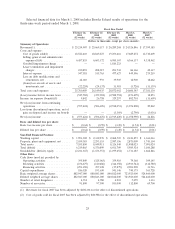
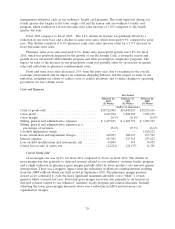
Costs and Expenses
Year Ended
February 26, February 27, February 28,
2011 2010 2009
(52 Weeks) (52 Weeks) (52 Weeks)
(Dollars in thousands)
Costs of goods sold ............................. $18,522,403 $18,845,027 $19,253,616
Gross profit ................................... 6,692,504 6,824,090 7,035,652
Gross margin .................................. 26.5% 26.6% 26.8%
Selling, general and administrative expenses ........... $ 6,457,833 $ 6,603,372 $ 6,985,367
Selling, general and administrative expenses as a
percentage of revenues ......................... 25.6% 25.7% 26.6%
Goodwill impairment charge ....................... — — 1,810,223
Lease termination and impairment charges ............ 210,893 208,017 293,743
Interest expense ................................ 547,581 515,763 477,627
Loss on debt modifications and retirements, net ........ 44,003 993 39,905
(Gain) loss on sale of assets, net .................... (22,224) (24,137) 11,581
Cost of Goods Sold
Gross margin rate was 26.5% for fiscal 2011 compared to 26.6% in fiscal 2010. The decline in
gross margin was due primarily to deferred revenue related to our wellness+ customer loyalty program
and a slight reduction in pharmacy gross margin, partially offset by lower product costs and new generic
introductions. There was a negative impact from the reductions in Medicare reimbursements resulting
from the AWP rollback which was fully cycled in September 2010. The pharmacy margin pressure
slowed as we continued to cycle the more significant maximum allowable costs (‘‘MAC’’) of new
generics which occurred last year. Front-end gross margin was lower due primarily to an increase in
deferred revenue related to our wellness+ customer loyalty program and related discounts. Partially
offsetting the lower gross margin discussed above was a reduction in LIFO and inventory cost
capitalization charges.
29