Rite Aid 2011 Annual Report Download - page 112
Download and view the complete annual report
Please find page 112 of the 2011 Rite Aid annual report below. You can navigate through the pages in the report by either clicking on the pages listed below, or by using the keyword search tool below to find specific information within the annual report.-
 1
1 -
2
-
3
-
4
-
5
-
6
-
7
-
8
-
9
-
10
-
11
-
12
-
13
-
14
-
15
-
16
-
17
-
18
-
19
-
20
-
21
-
22
-
23
-
24
-
25
-
26
-
27
-
28
-
29
-
30
-
31
-
32
-
33
-
34
-
35
-
36
-
37
-
38
-
39
-
40
-
41
-
42
-
43
-
44
-
45
-
46
-
47
-
48
-
49
-
50
-
51
-
52
-
53
-
54
-
55
-
56
-
57
-
58
-
59
-
60
-
61
-
62
-
63
-
64
-
65
-
66
-
67
-
68
-
69
-
70
-
71
-
72
-
73
-
74
-
75
-
76
-
77
-
78
-
79
-
80
-
81
-
82
-
83
-
84
-
85
-
86
-
87
-
88
-
89
-
90
-
91
-
92
-
93
-
94
-
95
-
96
-
97
-
98
-
99
-
100
-
101
-
 102
102 -
 103
103 -
 104
104 -
 105
105 -
 106
106 -
 107
107 -
 108
108 -
 109
109 -
 110
110 -
 111
111 -
 112
112 -
 113
113 -
 114
114 -
 115
115 -
 116
116 -
 117
117 -
 118
118 -
 119
119
 |
 |

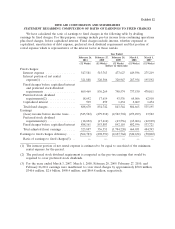
Exhibit 12
RITE AID CORPORATION AND SUBSIDIARIES
STATEMENT REGARDING COMPUTATION OF RATIO OF EARNINGS TO FIXED CHARGES
We have calculated the ratio of earnings to fixed charges in the following table by dividing
earnings by fixed charges. For this purpose, earnings include pre-tax income from continuing operations
plus fixed charges, before capitalized interest. Fixed charges include interest, whether expensed or
capitalized, amortization of debt expense, preferred stock dividend requirement and that portion of
rental expense which is representative of the interest factor in those rentals.
Year Ended
February 26, February 27, February 28, March 1, March 3,
2011 2010 2009 2008 2007
(52 Weeks) (52 Weeks) (52 Weeks) (52 Weeks) (52 Weeks)
(dollars in thousands)
Fixed charges:
Interest expense ................. 547,581 515,763 477,627 449,596 275,219
Interest portion of net rental
expense(1) .................... 321,888 320,506 320,947 287,934 195,592
Fixed charges before capitalized interest
and preferred stock dividend
requirements .................. 869,469 836,269 798,574 737,530 470,811
Preferred stock dividend
requirements(2) ................ 18,692 17,614 43,536 65,066 62,910
Capitalized interest ............... 509 859 1,434 2,069 1,474
Total fixed charges ................ 888,670 854,742 843,544 804,665 535,195
Earnings:
(Loss) income before income taxes .... (545,582) (479,918) (2,582,794) (273,499) 13,582
Preferred stock dividend
requirements(2) ................ (18,692) (17,614) (43,536) (65,066) (62,910)
Fixed charges before capitalized interest 888,161 853,883 842,110 802,596 533,721
Total adjusted (loss) earnings ........ 323,887 356,351 (1,784,220) 464,031 484,393
Earnings to fixed charges deficiency ..... (564,783) (498,391) (2,627,764) (340,634) (50,802)
Ratio of earnings to fixed charges(3) . . — — — — —
(1) The interest portion of net rental expense is estimated to be equal to one-third of the minimum
rental expense for the period.
(2) The preferred stock dividend requirement is computed as the pre-tax earnings that would be
required to cover preferred stock dividends.
(3) For the years ended March 3, 2007, March 1, 2008, February 28, 2009, February 27, 2010, and
February 26,2011 earnings were insufficient to cover fixed charges by approximately $50.8 million,
$340.6 million, $2.6 billion, $498.4 million, and $564.8 million, respectively.