Rite Aid 2011 Annual Report Download - page 42
Download and view the complete annual report
Please find page 42 of the 2011 Rite Aid annual report below. You can navigate through the pages in the report by either clicking on the pages listed below, or by using the keyword search tool below to find specific information within the annual report.-
 1
1 -
2
-
3
-
4
-
5
-
6
-
7
-
8
-
9
-
10
-
11
-
12
-
13
-
14
-
15
-
16
-
17
-
18
-
19
-
20
-
21
-
22
-
23
-
24
-
25
-
26
-
27
-
28
-
29
-
30
-
31
-
 32
32 -
 33
33 -
 34
34 -
 35
35 -
 36
36 -
 37
37 -
 38
38 -
 39
39 -
 40
40 -
 41
41 -
 42
42 -
 43
43 -
 44
44 -
 45
45 -
 46
46 -
 47
47 -
 48
48 -
 49
49 -
 50
50 -
 51
51 -
 52
52 -
53
-
54
-
55
-
56
-
57
-
58
-
59
-
60
-
61
-
62
-
63
-
64
-
65
-
66
-
67
-
68
-
69
-
70
-
71
-
72
-
73
-
74
-
75
-
76
-
77
-
78
-
79
-
80
-
81
-
82
-
83
-
84
-
85
-
86
-
87
-
88
-
89
-
90
-
91
-
92
-
93
-
94
-
95
-
96
-
97
-
98
-
99
-
100
-
101
-
102
-
103
-
104
-
105
-
106
-
107
-
108
-
109
-
110
-
111
-
112
-
113
-
114
-
115
-
116
-
117
-
118
-
119
 |
 |

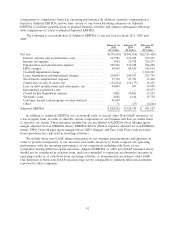
comparisons to competitors’ historical operating performance In addition, incentive compensation is
based on Adjusted EBITDA and we base certain of our forward-looking estimates on Adjusted
EBITDA to facilitate quantification of planned business activities and enhance subsequent follow-up
with comparisons of actual to planned Adjusted EBITDA.
The following is a reconciliation of Adjusted EBITDA to our net loss for fiscal 2011, 2010 and
2009:
February 26, February 27, February 28,
2011 2010 2009
(52 weeks) (52 weeks) (52 weeks)
Net loss ......................................... $(555,424) $(506,676) $(2,915,420)
Interest expense and securitization costs ................ 547,581 552,625 503,691
Income tax expense ............................... 9,842 26,758 329,257
Depreciation and amortization expense ................. 505,546 534,238 586,208
LIFO charges ................................... 44,905 88,450 184,569
Goodwill impairment charge ........................ — — 1,810,223
Lease termination and impairment charges .............. 210,893 208,017 293,743
Stock-based compensation expense .................... 17,336 23,794 31,448
(Gain) loss on sale of assets, net ..................... (22,224) (24,137) 11,629
Loss on debt modifications and retirements, net .......... 44,003 993 39,905
Incremental acquisition costs ........................ — — 85,633
Closed facility liquidation expense .................... 9,881 14,801 19,353
Severance costs .................................. 4,883 6,184 15,754
Customer loyalty card programs revenue deferral ......... 41,669 — —
Other ......................................... 71 (73) (4,846)
Adjusted EBITDA ................................. $858,962 $ 924,974 $ 991,147
In addition to Adjusted EBITDA, we occasionally refer to several other Non-GAAP measures, on
a less frequent basis, in order to describe certain components of our business and how we utilize them
to describe our results. These measures include but are not limited to EBITDA Gross Margin (gross
margin adjusted for non-EBITDA items), EBITDA SG&A (SG&A expenses adjusted for non-EBITDA
items), FIFO Gross Margin (gross margin before LIFO charges) and Free Cash Flow (cash provided
from operations less cash used in investing activities).
We include these non-GAAP financial measures in our earnings announcements and guidance in
order to provide transparency to our investors and enable investors to better compare our operating
performance with the operating performance of our competitors including with those of our
competitors having different capital structures. Adjusted EBITDA or other non-GAAP measures above
should not be considered in isolation from, and is not intended to represent an alternative measure of,
operating results or of cash flows from operating activities, as determined in accordance with GAAP.
Our definition of these non-GAAP measures may not be comparable to similarly titled measurements
reported by other companies.
42