Rite Aid 2011 Annual Report Download - page 101
Download and view the complete annual report
Please find page 101 of the 2011 Rite Aid annual report below. You can navigate through the pages in the report by either clicking on the pages listed below, or by using the keyword search tool below to find specific information within the annual report.-
 1
1 -
2
-
3
-
4
-
5
-
6
-
7
-
8
-
9
-
10
-
11
-
12
-
13
-
14
-
15
-
16
-
17
-
18
-
19
-
20
-
21
-
22
-
23
-
24
-
25
-
26
-
27
-
28
-
29
-
30
-
31
-
32
-
33
-
34
-
35
-
36
-
37
-
38
-
39
-
40
-
41
-
42
-
43
-
44
-
45
-
46
-
47
-
48
-
49
-
50
-
51
-
52
-
53
-
54
-
55
-
56
-
57
-
58
-
59
-
60
-
61
-
62
-
63
-
64
-
65
-
66
-
67
-
68
-
69
-
70
-
71
-
72
-
73
-
74
-
75
-
76
-
77
-
78
-
79
-
80
-
81
-
82
-
83
-
84
-
85
-
86
-
87
-
88
-
89
-
90
-
 91
91 -
 92
92 -
 93
93 -
 94
94 -
 95
95 -
 96
96 -
 97
97 -
 98
98 -
 99
99 -
 100
100 -
 101
101 -
 102
102 -
 103
103 -
 104
104 -
 105
105 -
 106
106 -
 107
107 -
 108
108 -
 109
109 -
 110
110 -
 111
111 -
112
-
113
-
114
-
115
-
116
-
117
-
118
-
119
 |
 |

RITE AID CORPORATION AND SUBSIDIARIES
NOTES TO CONSOLIDATED FINANCIAL STATEMENTS (Continued)
For the Years Ended February 26, 2011, February 27, 2010 and February 28, 2009
(In thousands, except per share amounts)
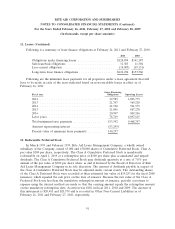
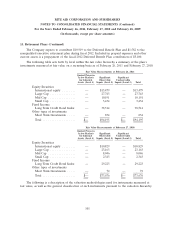
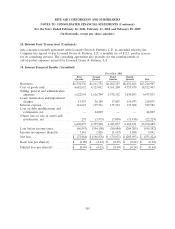
15. Retirement Plans (Continued)
The Company expects to contribute $10,919 to the Deferred Benefit Plan and $1,582 to the
nonqualified executive retirement plan during fiscal 2012. Included in prepaid expenses and other
current assets is a prepayment of the fiscal 2012 Deferred Benefit Plan contribution of $5,100.
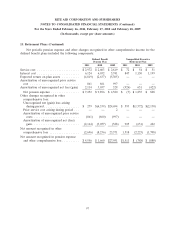
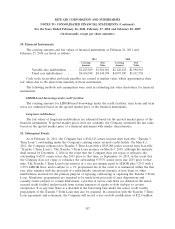
The following table sets forth by level within the fair value hierarchy a summary of the plan’s
investments measured at fair value on a recurring basis as of February 26, 2011 and February 27, 2010:
Fair Value Measurements at February 26, 2011
Quoted Prices in
Active Markets Significant Significant
for Identical Observable Unobservable
Assets (Level 1) Inputs (Level 2) Inputs (Level 3) Total
Equity Securities
International equity ........ — $13,479 — $13,479
Large Cap ............... — 27,743 — 27,743
Mid Cap ................ — 10,191 — 10,191
Small Cap ............... — 3,434 — 3,434
Fixed Income
Long Term Credit Bond Index — 38,514 — 38,514
Other types of investments
Short Term Investments ..... — 834 — 834
Total ................... $— $94,195 $— $94,195
Fair Value Measurements at February 27, 2010
Quoted Prices in
Active Markets Significant Significant
for Identical Observable Unobservable
Assets (Level 1) Inputs (Level 2) Inputs (Level 3) Total
Equity Securities
International equity ........ — $10,829 — $10,829
Large Cap ............... — 23,163 — 23,163
Mid Cap ................ — 8,046 — 8,046
Small Cap ............... — 2,343 — 2,343
Fixed Income
Long Term Credit Bond Index — 29,223 — 29,223
Other types of investments
Short Term Investments ..... — 72 — 72
Total ................... $— $73,676 $— $73,676
The following is a description of the valuation methodologies used for instruments measured at
fair value, as well as the general classification of such instruments pursuant to the valuation hierarchy.
101