Qantas 2007 Annual Report Download - page 92
Download and view the complete annual report
Please find page 92 of the 2007 Qantas annual report below. You can navigate through the pages in the report by either clicking on the pages listed below, or by using the keyword search tool below to find specific information within the annual report.-
 1
1 -
2
-
3
-
4
-
5
-
6
-
7
-
8
-
9
-
10
-
11
-
12
-
13
-
14
-
15
-
16
-
17
-
18
-
19
-
20
-
21
-
22
-
23
-
24
-
25
-
26
-
27
-
28
-
29
-
30
-
31
-
32
-
33
-
34
-
35
-
36
-
37
-
38
-
39
-
40
-
41
-
42
-
43
-
44
-
45
-
46
-
47
-
48
-
49
-
50
-
51
-
52
-
53
-
54
-
55
-
56
-
57
-
58
-
59
-
60
-
61
-
62
-
63
-
64
-
65
-
66
-
67
-
68
-
69
-
70
-
71
-
72
-
73
-
74
-
75
-
76
-
77
-
78
-
79
-
80
-
81
-
 82
82 -
 83
83 -
 84
84 -
 85
85 -
 86
86 -
 87
87 -
 88
88 -
 89
89 -
 90
90 -
 91
91 -
 92
92 -
 93
93 -
 94
94 -
 95
95 -
 96
96 -
 97
97 -
 98
98 -
 99
99 -
 100
100 -
 101
101 -
 102
102 -
103
-
104
-
105
-
106
-
107
-
108
-
109
-
110
-
111
-
112
-
113
-
114
-
115
-
116
-
117
-
118
-
119
-
120
-
121
-
122
-
123
-
124
-
125
-
126
-
127
-
128
-
129
-
130
-
131
-
132
-
133
-
134
-
135
-
136
-
137
-
138
-
139
-
140
-
141
-
142
-
143
-
144
 |
 |
90 Qantas |Annual Report 2007
Qantas Group Qantas
2007
$M
2006
$M
2007
$M
2006
$M
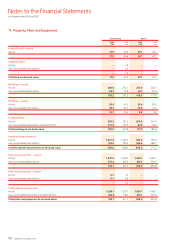
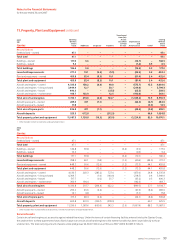
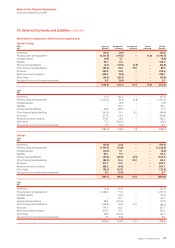
Freehold land – owned
At cost 71.9 65.6 47.1 47.1
71.9 65.6 47.1 47.1
Leasehold land
At cost –1.8 ––
Less: accumulated amortisation –0.2 ––
–1.6 ––
Total land at net book value 71.9 67.2 47.1 47.1
Buildings – owned
At cost 280.9 272.1 235.6 232.0
Less: accumulated depreciation 85.7 70.8 67.1 55.0
195.2 201.3 168.5 177.0
Buildings – leased
At cost 58.4 60.2 29.0 29.0
Less: accumulated amortisation 45.7 44.7 20.5 19.6
12.7 15.5 8.5 9.4
Total buildings
At cost 339.3 332.3 264.6 261.0
Less: accumulated depreciation and amortisation 131.4 115.5 87.6 74.6
Total buildings at net book value 207.9 216.8 177.0 186.4
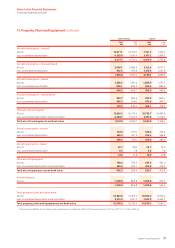
Leasehold improvements
At cost 1,331.5 1,252.3 832.8 759.9
Less: accumulated amortisation 767.9 703.9 428.6 388.7
Total leasehold improvements at net book value 563.6 548.4 404.2 371.2
Plant and equipment – owned
At cost 1,291.4 1,220.7 1,039.1 1,006.1
Less: accumulated depreciation 779.3 709.2 607.1 550.3
512.1 511.5 432.0 455.8
Plant and equipment – leased
At cost 6.7 7.0 ––
Less: accumulated amortisation 6.7 6.8 ––
–0.2 ––
Total plant and equipment
At cost 1,298.1 1,227.7 1,039.1 1,006.1
Less: accumulated depreciation and amortisation 786.0 716.0 607.1 550.3
Total plant and equipment at net book value 512.1 511.7 432.0 455.8
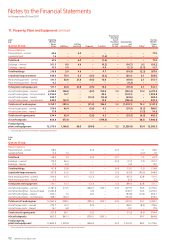
11. Property, Plant and Equipment
Notes to the Financial Statements
for the year ended 30 June 2007