Qantas 2007 Annual Report Download - page 87
Download and view the complete annual report
Please find page 87 of the 2007 Qantas annual report below. You can navigate through the pages in the report by either clicking on the pages listed below, or by using the keyword search tool below to find specific information within the annual report.-
 1
1 -
2
-
3
-
4
-
5
-
6
-
7
-
8
-
9
-
10
-
11
-
12
-
13
-
14
-
15
-
16
-
17
-
18
-
19
-
20
-
21
-
22
-
23
-
24
-
25
-
26
-
27
-
28
-
29
-
30
-
31
-
32
-
33
-
34
-
35
-
36
-
37
-
38
-
39
-
40
-
41
-
42
-
43
-
44
-
45
-
46
-
47
-
48
-
49
-
50
-
51
-
52
-
53
-
54
-
55
-
56
-
57
-
58
-
59
-
60
-
61
-
62
-
63
-
64
-
65
-
66
-
67
-
68
-
69
-
70
-
71
-
72
-
73
-
74
-
75
-
76
-
 77
77 -
 78
78 -
 79
79 -
 80
80 -
 81
81 -
 82
82 -
 83
83 -
 84
84 -
 85
85 -
 86
86 -
 87
87 -
 88
88 -
 89
89 -
 90
90 -
 91
91 -
 92
92 -
 93
93 -
 94
94 -
 95
95 -
 96
96 -
 97
97 -
98
-
99
-
100
-
101
-
102
-
103
-
104
-
105
-
106
-
107
-
108
-
109
-
110
-
111
-
112
-
113
-
114
-
115
-
116
-
117
-
118
-
119
-
120
-
121
-
122
-
123
-
124
-
125
-
126
-
127
-
128
-
129
-
130
-
131
-
132
-
133
-
134
-
135
-
136
-
137
-
138
-
139
-
140
-
141
-
142
-
143
-
144
 |
 |

85Qantas |Annual Report 2007
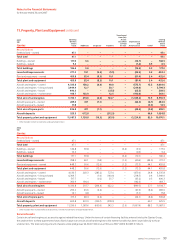
Qantas Group Qantas
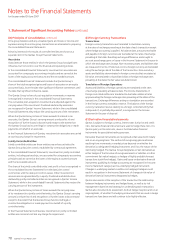
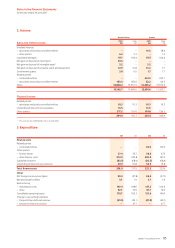
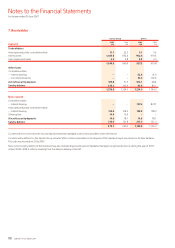
Sales and Other Income 2007
$M
2006
$M
2007
$M
2006
$M
Dividend revenue
associates and jointly controlled entities–––16.5 18.4
other parties–6.0 3.3 –1.3
Liquidated damages 97.7 104.4 97.5 104.4
Net gain on disposal of investment 30.6 –––
Net gain on disposal of intangible asset13.2 –3.2 –
Net gain on disposal of property, plant and equipment 12.9 10.8 13.3 7.7
Government grants 3.8 6.0 1.7 1.7
Related parties
controlled entities –––461.0 233.1
associates and jointly controlled entities–183.3 183.6 32.2 44.5
Other 14,828.2 13,352.5 12,065.2 10,914.6
15,165.7 13,660.6 12,690.6 11, 325.7
Finance income
Related parties
associates and jointly controlled entities–10.3 10.3 10.3 10.3
Unwinding of discount on receivables 16.5 –16.5 –
Other parties 217.2 153.0 199.8 136.3
244.0 163.3 226.6 146.6
This asset was classified held for sale at 30 June 2006.
3. Expenditure
$M $M $M $M
Finance costs
Related parties
controlled entities–––83.0 80.3
Other parties
finance leases–37.4 39.7 38.8 37.9
other finance costs–273.9 229.8 202.9 161.0
Capitalised interest (83.3) (68.4) (83.3) (68.4)
Unwinding of discount on provisions 30.9 16.8 30.9 16.8
Total finance costs 258.9 217.9 272.3 227.6
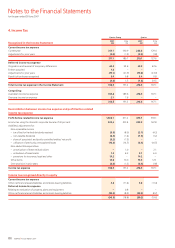
Other
Net foreign currency loss /(gain) 89.0 (57.8) 84.0 (57.3)
Bad and doubtful debts 3.7 1.9 3.7 1.6
Restructuring
redundancy costs–147.4 108.6 147.3 104.6
other–87.7 72.9 87.7 72.9
Cancellable operating leases 170.7 163.2 157.6 149.0
Change in accounting estimates
Frequent Flyer deferred revenue–(41.9) (49.1) (41.9) (49.1)
long service leave provisions––47.7 –47.7
1
2. Income
Notes to the Financial Statements
for the year ended 30 June 2007