Qantas 2007 Annual Report Download - page 68
Download and view the complete annual report
Please find page 68 of the 2007 Qantas annual report below. You can navigate through the pages in the report by either clicking on the pages listed below, or by using the keyword search tool below to find specific information within the annual report.-
 1
1 -
2
-
3
-
4
-
5
-
6
-
7
-
8
-
9
-
10
-
11
-
12
-
13
-
14
-
15
-
16
-
17
-
18
-
19
-
20
-
21
-
22
-
23
-
24
-
25
-
26
-
27
-
28
-
29
-
30
-
31
-
32
-
33
-
34
-
35
-
36
-
37
-
38
-
39
-
40
-
41
-
42
-
43
-
44
-
45
-
46
-
47
-
48
-
49
-
50
-
51
-
52
-
53
-
54
-
55
-
56
-
57
-
 58
58 -
 59
59 -
 60
60 -
 61
61 -
 62
62 -
 63
63 -
 64
64 -
 65
65 -
 66
66 -
 67
67 -
 68
68 -
 69
69 -
 70
70 -
 71
71 -
 72
72 -
 73
73 -
 74
74 -
 75
75 -
 76
76 -
 77
77 -
 78
78 -
79
-
80
-
81
-
82
-
83
-
84
-
85
-
86
-
87
-
88
-
89
-
90
-
91
-
92
-
93
-
94
-
95
-
96
-
97
-
98
-
99
-
100
-
101
-
102
-
103
-
104
-
105
-
106
-
107
-
108
-
109
-
110
-
111
-
112
-
113
-
114
-
115
-
116
-
117
-
118
-
119
-
120
-
121
-
122
-
123
-
124
-
125
-
126
-
127
-
128
-
129
-
130
-
131
-
132
-
133
-
134
-
135
-
136
-
137
-
138
-
139
-
140
-
141
-
142
-
143
-
144
 |
 |
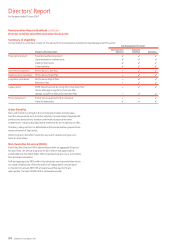
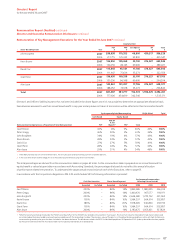
66 Qantas |Annual Report 2007
Directors’ Report
for the year ended 30 June 2007
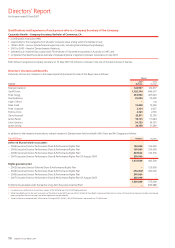
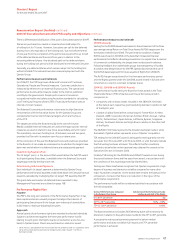
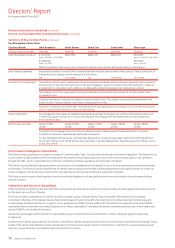
RemunerationofDirectorsfortheYearEnded30June2007continued
Equity Settled
1Share-Based Payment Year
PSP
$
PRP
$
Exec Director LTI
$
RP
$
Total
$
Geoff Dixon 2007 532,843 622,500 – – 1,155,343
2006 572,805 491,625 189,473 – 1,253,903
Peter Gregg 2007 319,706 219,094 27,174 465,050 1,031,024
2006 334,233 197,762 194,543 – 726,538
Total 2007 852,549 841,594 27,174 465,050 2,186,367
2006 907,038 689,387 384,016 – 1,980,441
Directors’ and Officers’ liability insurance has not been included in the above figures since it is not possible to determine an appropriate allocation basis.
Non-Executive Directors do not receive any performance related remuneration.
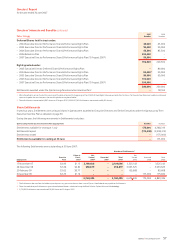
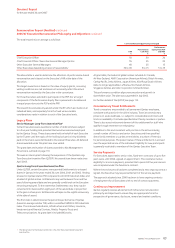
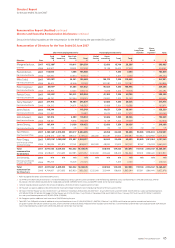
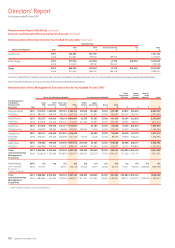
RemunerationofKeyManagementExecutivesfortheYearEnded30June2007
Short-Term Employee Benefits Post Employment Benefits
Other
Long-Term
Benefits
Share-
Based
Payment1
Termin-
ation
Benefits Total
Key Management
and Highest
Remunerated
Executives Year
Cash
FAR
$
Cash
Incentives
$
Non-Cash
Benefits
$
Total
$
End of
Service
$
Super-
annuation
$
Travel
$
Total
$$$$ $
John Borghetti, 2007 1,119,474 1,380,000 183,720
2,683,194
196,500 159,389 15,700 371,589 90,812 936,328 – 4,081,923
EGM Qantas 2006 982,003 478,000 192,762 1,652,765 643,500 122,922 15,400 781,822 352,325 435,547 – 3,222,459
Kevin Brown, 2007 673,573 625,000 186,114 1,484,687 53,333 42,385 15,700 111,418 20,000 653,945 – 2,270,050
EGM People 2006 645,228 234,000 198,222 1,077,450 211,334 40,560 15,400 267,294 26,458 286,021 – 1,657,223
David Cox, 2007 607,076 505,000 102,211 1,214,287 – 42,385 15,700 58,085 17,000 605,502 – 1,894,874
EGM Engineering 2006 599,785 199,000 38,496 837,281 105,000 12,139 15,400 132,539 67,918 222,556 – 1,260,294
Grant Fenn, 2007 680,113 625,000 210,506 1,515,619 – 42,385 15,700 58,085 20,000 657,915 – 2,251,619
EGM Freight
Enterprises
2006 693,037 234,000 180,099 1,107,136 70,000 12,139 15,400 97,539 39,916 294,204 – 1,538,795
Alan Joyce, 2007 778,646 775,000 105,592 1,659,238 250,000 42,385 15,700 308,085 58,068 638,571 – 2,663,962
CEO Jetstar 2006 608,066 210,000 70,275 888,341 156,667 40,560 15,400 212,627 25,719 296,843 – 1,423,530
Total
remuneration Key
Management
Executives
2007 3,858,882 3,910,000 788,143
8,557,025
499,833 328,929 78,500 907,262 205,880 3,492,261 –
13,162,428
2006 3,528,119 1,355,000 679,854 5,562,973 1,186,501 228,320 77,000 1,491,821 512,336 1,535,171 – 9,102,301
Denis Adams, 2007 n/a n/a n/a n/a n/a n/a n/a n/a n/a n/a n/a n/a
EGM Associated
Businesses
(1 Jul 05 - 31 Dec 05)
2006 357,743 – 48,375 406,118 45,000 6,070 15,400 66,470 16,177 140,380 1,358,024 1,987,169
Total
remuneration Key
Management
Executives
2007 3,858,882 3,910,000 788,143
8,557,025
499,833 328,929 78,500 907,262 205,880 3,492,261 –
13,162,428
2006 3,885,862 1,355,000 728,229 5,969,091 1,231,501 234,390 92,400 1,558,291 528,513 1,675,551 1,358,024 11,089,470
Refer to page 67 for details of Share-Based Payments.
1
Remuneration Report (Audited) continued
Director and Executive Remuneration Disclosures continued