Qantas 2007 Annual Report Download - page 53
Download and view the complete annual report
Please find page 53 of the 2007 Qantas annual report below. You can navigate through the pages in the report by either clicking on the pages listed below, or by using the keyword search tool below to find specific information within the annual report.-
 1
1 -
2
-
3
-
4
-
5
-
6
-
7
-
8
-
9
-
10
-
11
-
12
-
13
-
14
-
15
-
16
-
17
-
18
-
19
-
20
-
21
-
22
-
23
-
24
-
25
-
26
-
27
-
28
-
29
-
30
-
31
-
32
-
33
-
34
-
35
-
36
-
37
-
38
-
39
-
40
-
41
-
42
-
 43
43 -
 44
44 -
 45
45 -
 46
46 -
 47
47 -
 48
48 -
 49
49 -
 50
50 -
 51
51 -
 52
52 -
 53
53 -
 54
54 -
 55
55 -
 56
56 -
 57
57 -
 58
58 -
 59
59 -
 60
60 -
 61
61 -
 62
62 -
 63
63 -
64
-
65
-
66
-
67
-
68
-
69
-
70
-
71
-
72
-
73
-
74
-
75
-
76
-
77
-
78
-
79
-
80
-
81
-
82
-
83
-
84
-
85
-
86
-
87
-
88
-
89
-
90
-
91
-
92
-
93
-
94
-
95
-
96
-
97
-
98
-
99
-
100
-
101
-
102
-
103
-
104
-
105
-
106
-
107
-
108
-
109
-
110
-
111
-
112
-
113
-
114
-
115
-
116
-
117
-
118
-
119
-
120
-
121
-
122
-
123
-
124
-
125
-
126
-
127
-
128
-
129
-
130
-
131
-
132
-
133
-
134
-
135
-
136
-
137
-
138
-
139
-
140
-
141
-
142
-
143
-
144
 |
 |
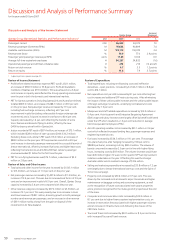
Discussion and Analysis of the Income Statement continued
Depreciation and amortisation increased by $112.9 million or 9.0 per
cent reflecting increased depreciation on aircraft modifications and
capitalised maintenance.
Non-cancellable operating lease rentals increased by $59.6 million or
16.8 per cent reflecting the full year impact of 15 Jetstar A320 aircraft
and nine B738 aircraft delivered in the prior year.
Capacity hire costs decreased by $66.4 million or 18.0 per cent largely
due to a move to a freesale codeshare arrangement with Air Pacific and
Air Vanuatu and the return of five BAE 146 aircraft during the current
and prior years.
Other expenditure increased by $215.0 million or 49.2 per cent largely
due to a loss on foreign currency hedges in the current year compared to
a gain in the prior year (largely attributable to US dollar hedging), the
impairment of the investment in Air New Zealand and higher legal and
consultancy fees.
The share of net profit in associates and jointly controlled entities
increased by $7.6 million to $46.5 million. The main contributors to
this result were the investments in Star Track Express and Australian
air Express.
Review of Other Income Statement Items
The requirement to mark-to-market open derivative positions under
AASB 139 resulted in ineffective derivative losses of $54.1 million in
the current year.
Net finance costs decreased by $39.7 million or 72.7 per cent. This
reflects additional interest received from a higher average cash balance
and interest revenue on the unwinding of the discount on liquidated
damages. This was offset by higher financing costs associated with
higher interest rates on debt.
The favourable net impact of foreign exchange rate movements on the
overall PBT was $2.0 million.
The effective tax rate increased from 28.5 per cent to 30.3 per cent.
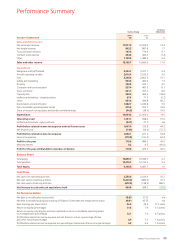
Basic earnings per share increased by 11.5 cents to 36.4 cents. This
reflected the increased profit after tax for the year.
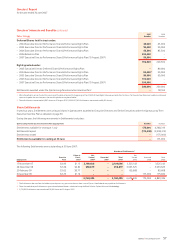
Discussion and Analysis of the Balance Sheet
The net assets of the Qantas Group increased by 1.9 per cent to
$6,195.0 million during the year. The major movements are
discussed below.
Review of Total Assets
Total cash and current receivables increased by $713.4 million reflecting
an increase of $460.9 million in net cash as discussed below, and an
increase in current receivables of $252.5 million due to increased traffic
and the disposal of the investment of Air New Zealand Limited in June
2007.
Property, plant and equipment remained consistent which reflected
capital expenditure on new aircraft acquisitions including one A330-300
and three Q400, and progress payments made on the A380, B787,
B738 and A330 aircraft. This was offset by depreciation and
amortisation charge of $1,362.7 million.
•
•
•
•
•
•
•
•
•
•
•
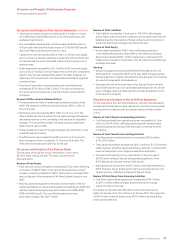
Review of Total Liabilities
Total liabilities increased by 2.4 per cent to $13,410.7 million largely
due to higher revenue received in advance and increased other financial
liabilities driven by the maturity of hedge contracts and movements in
fuel prices and foreign exchange rates during the year.
Review of Total Equity
Issued capital increased by $99.0 million reflecting participation
in the Dividend Reinvestment Plan (DRP) for the 2006 final dividend.
Reserves decreased by $181.1 million mainly due to a decrease in the
hedge reserve caused by movements in the fair value of fuel and foreign
exchange derivatives.
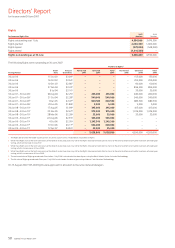
Gearing
Qantas Group gearing (including off Balance Sheet debt) at 30 June
2007 was 39:61 compared to 45:55 at 30 June 2006. The gearing ratio
has decreased due to higher cash balances and a decrease in borrowings
as a result of repayments and revaluations.
Gearing is the ratio of the book value of the Qantas Group’s net debt
(short and long-term plus non-cancellable operating leases less the fair
value of hedges relating to debt and cash and cash equivalents) to the
book value of total equity.
Discussion and Analysis of the Cash Flow Statement
For the purposes of the Cash Flow Statement, cash and cash equivalents
includes cash at bank and on hand, cash at call, short-term money market
securities and term deposits with an original maturity of three months
or less.
Review of Cash Flows From Operating Activities
Cash flows provided from operating activities increased by 16.2 per
cent to $2,353.4 million, reflecting revenue growth during the year
and strong advance bookings reflected as cash in revenue received
in advance.
Review of Cash Flows From Investing Activities
Cash flows used in investing activities increased by $330.6 million
to $1,220.2 million.
Total capital expenditure decreased by $291.2 million to $1,235.9 million
reflecting lower aircraft progress and delivery payments, combined with
lower reconfiguration costs, engine modifications and spares.
Proceeds from financing of non-current assets in the prior year of
$627.8 million relates to the sale and operating leaseback of nine
B737-800 aircraft and seven Jetstar A320 aircraft.
Net payments for investments of $32.1 million reflected investments in
DPEX Transport Group, Kilda Express and the remaining interest in Jet
Turbine Services, offset by the disposal of Thai Air Cargo.
Review Of Cash Flows From Financing Activities
Cash flows used in financing activities increased by $534.1 million
to $672.3 million reflecting higher dividend and net borrowing
payments in the current year.
The Qantas Group held cash of $3,362.9 million and had access to
additional funding of $1,170.0 million as at 30 June 2007. This comprised
a $500.0 million stand-by facility and a $670.0 million revolving facility
under a syndicated loan.
•
•
•
•
•
•
•
•
•
•
51Qantas |Annual Report 2007
Discussion and Analysis of Performance Summary
for the year ended 30 June 2007