Qantas 2007 Annual Report Download - page 67
Download and view the complete annual report
Please find page 67 of the 2007 Qantas annual report below. You can navigate through the pages in the report by either clicking on the pages listed below, or by using the keyword search tool below to find specific information within the annual report.-
 1
1 -
2
-
3
-
4
-
5
-
6
-
7
-
8
-
9
-
10
-
11
-
12
-
13
-
14
-
15
-
16
-
17
-
18
-
19
-
20
-
21
-
22
-
23
-
24
-
25
-
26
-
27
-
28
-
29
-
30
-
31
-
32
-
33
-
34
-
35
-
36
-
37
-
38
-
39
-
40
-
41
-
42
-
43
-
44
-
45
-
46
-
47
-
48
-
49
-
50
-
51
-
52
-
53
-
54
-
55
-
56
-
 57
57 -
 58
58 -
 59
59 -
 60
60 -
 61
61 -
 62
62 -
 63
63 -
 64
64 -
 65
65 -
 66
66 -
 67
67 -
 68
68 -
 69
69 -
 70
70 -
 71
71 -
 72
72 -
 73
73 -
 74
74 -
 75
75 -
 76
76 -
 77
77 -
78
-
79
-
80
-
81
-
82
-
83
-
84
-
85
-
86
-
87
-
88
-
89
-
90
-
91
-
92
-
93
-
94
-
95
-
96
-
97
-
98
-
99
-
100
-
101
-
102
-
103
-
104
-
105
-
106
-
107
-
108
-
109
-
110
-
111
-
112
-
113
-
114
-
115
-
116
-
117
-
118
-
119
-
120
-
121
-
122
-
123
-
124
-
125
-
126
-
127
-
128
-
129
-
130
-
131
-
132
-
133
-
134
-
135
-
136
-
137
-
138
-
139
-
140
-
141
-
142
-
143
-
144
 |
 |

65Qantas |Annual Report 2007
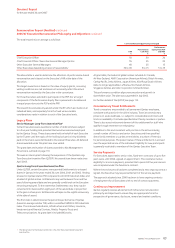
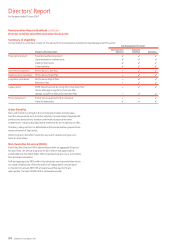
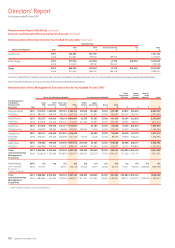
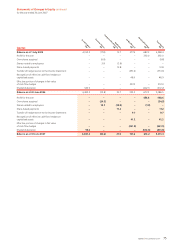
Directors’ Report
for the year ended 30 June 2007
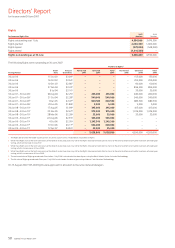
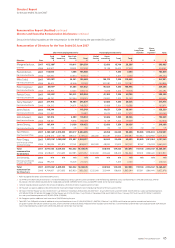
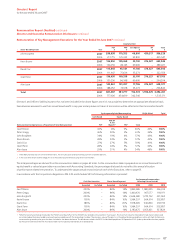
Set out in the following tables are the remuneration for the KMP during the year ended 30 June 2007:
RemunerationofDirectorsfortheYearEnded30June2007
Short-Term Employee Benefits Post Employment Benefits
Other
Long-Term
Benefits
Share-
Based
Payment1Total
Directors Year
Cash
FAR
$
Cash
Incentives
$
Non-Cash
Benefits
$
Total
$
End of
Service
$
Super-
annuation
$
Travel
$
Total
$$$ $
Margaret Jackson, 2007 453,3882– 110,911 564,299 – 12,686 15,700 28,386 – – 592,685
Chairman 2006 447,617 – 59,591 507,208 – 12,139 15,400 27,539 – – 534,747
Paul Anderson, 2007 154,800 – 1,688156,488––7,3507,350––163,838
Non-Executive Director 2006 146,400 – 10,634 157,034 – – 7,200 7,200 – – 164,234
Mike Codd, 2007 101,2872– 34,201 135,488 – 105,113 7,350 112,463 – – 247,951
Non-Executive Director 2006 94,613 – 42,426 137,039 – 100,587 7,200 107,787 – – 244,826
Peter Cosgrove,32007 83,9572– 51,485 135,442 – 96,643 7,350 103,993 – – 239,435
Non-Executive Director 2006 146,970 – 37,243 184,213 – 11,878 7,200 19,078 – – 203,291
Patricia Cross, 2007 80,3432– 155,251 235,594 – 42,385 7,350 49,735 – – 285,329
Non-Executive Director 2006 64,757 – 153,544 218,301 – 25,000 7,200 32,200 – – 250,501
Garry Hounsell,42007 217,914 – 78,965 296,879 – 12,686 7,350 20,036 – – 316,915
Non-Executive Director 2006 134,312 – 34,071 168,383 – 12,088 7,200 19,288 – – 187,671
James Packer, 2007 118,349 – – 118,349 – 10,651 7,350 18,001 – – 136,350
Non-Executive Director 20 06 111,927 – – 111,927 – 10,073 7,20 0 17,273 – – 129,20 0
John Schubert, 2007 167,914 – 6,589 174,503 – 12,686 7,350 20,036 – – 194,539
Non-Executive Director 2006 158,661 – 9,678 168,339 – 12,139 7,200 19,339 – – 187,678
James Strong, 2007 167,914 – 31,138 199,052 – 12,686 7,350 20,036 – – 219,088
Non-Executive Director 2006 n/a n/a n/a n/a n/a n/a n/a n/a n/a n/a n/a
Geoff Dixon, 2007 2,180,16852,915,000 259,217 5,354,385 – 67,058 32,400 99,458 98,065 1,155,343 6,707,251
Chief Executive Officer 2006 2,018,514 1,011,780 289,247 3,319,541 465,000 100,587 31,800 597,387 100,644 1,253,903 5,271,475
Peter Gregg, 2007 1,251,01051,494,0006213,587
2,958,597
– 36,000 32,400 68,400 99,039 1,031,024 4,157,060
Chief Financial Officer
and EGM Strategy 2006 1,185,836 501,875 211,161 1,898,872 867,000 48,953 31,800 947,753 87,167 726,538 3,660,330
Total
remuneration
for Directors
2007 4,977,044 4,409,000 943,032
10,329,076
– 408,594 139,300 547,894 197,104 2,186,367 13,260,441
2006 4,509,607 1,513,655 847,595 6,870,857 1,332,000 333,444 129,400 1,794,844 187,811 1,980,441 10,833,953
Jim Kennedy, 2007 n/a n/a n/a n/a n/a n/a n/a n/a n/a n/a n/a
Non-Executive Director
(1 Jul 05 - 30 Jun 06) 2006 195,200 – 16,325 211,525 – – 7,200 7,200 – – 218,725
Total
remuneration
for Directors
2007 4,977,04474,409,000 943,032
10,329,076
– 408,594 139,300 547,894 197,104 2,186,367 13,260,441
2006 4,704,807 1,513,655 863,920 7,082,382 1,332,000 333,444 136,600 1,802,044 187,811 1,980,441 11,052,678
Refer to page 66 for details of Share-Based Payments.
Cash FAR for the Non-Executive Directors is stated after deducting statory superannuation contribtions and the following additional salary sacrificed amounts: $49,926 (2006: $28,244) for
Ms Jackson, $92,427 (2006: $88,448) for Mr Codd, $86,342 (2006: $69,555) for Mrs Cross and $83,957 (2006: nil) for General Cosgrove.
General Cosgrove receives payments for services rendered as a Director of Qantas Superannuation Limited.
Mr Hounsell was paid an additional fee of $50,000 for chairing the Target Statement Committee during the Airline Partner Australia Offer.
Mr Dixon’s FAR for the year was $2,310,000 from 1 July 2006 to 31 December 2006 and $2,430,00 0 from 1 January 2007 to 30 June 2007 (2006: $2,235,000) less salary sacrificed components
of $189,832 (2006: $216,486). Mr Gregg’s FAR for the year was $1,375,0 0 0 from 1 July 2006 to 31 December 2006 and $1,450,000 from 1 Januar y 2007 to 30 June 2007 (2006: $1,342,500)
less salar y sacrificed components of $161,49 0 (20 06: $156,664).
Mr Gregg was paid an additional cash incentive of $44,000 during the year.
Total NED Cash FAR paid inclusive of additional salary sacrificed elements was $1,858,518 (2006: $1,686,704). Effective 1 July 2006, each Director was paid an annual base fee inclusive
of superannuation of $129,000 (2006: $122,000), and the Chairman $516,000 (2006: $488,000) which includes Committee fees. Committee fees for other NEDs were $25,800 (2006: $24,400) per
Committee Membership and $51,600 (2006: $48,800) per Committee Chairmanship.
1
2
3
4
5
6
7
Remuneration Report (Audited) continued
Director and Executive Remuneration Disclosures continued