Qantas 2007 Annual Report Download - page 52
Download and view the complete annual report
Please find page 52 of the 2007 Qantas annual report below. You can navigate through the pages in the report by either clicking on the pages listed below, or by using the keyword search tool below to find specific information within the annual report.-
 1
1 -
2
-
3
-
4
-
5
-
6
-
7
-
8
-
9
-
10
-
11
-
12
-
13
-
14
-
15
-
16
-
17
-
18
-
19
-
20
-
21
-
22
-
23
-
24
-
25
-
26
-
27
-
28
-
29
-
30
-
31
-
32
-
33
-
34
-
35
-
36
-
37
-
38
-
39
-
40
-
41
-
 42
42 -
 43
43 -
 44
44 -
 45
45 -
 46
46 -
 47
47 -
 48
48 -
 49
49 -
 50
50 -
 51
51 -
 52
52 -
 53
53 -
 54
54 -
 55
55 -
 56
56 -
 57
57 -
 58
58 -
 59
59 -
 60
60 -
 61
61 -
 62
62 -
63
-
64
-
65
-
66
-
67
-
68
-
69
-
70
-
71
-
72
-
73
-
74
-
75
-
76
-
77
-
78
-
79
-
80
-
81
-
82
-
83
-
84
-
85
-
86
-
87
-
88
-
89
-
90
-
91
-
92
-
93
-
94
-
95
-
96
-
97
-
98
-
99
-
100
-
101
-
102
-
103
-
104
-
105
-
106
-
107
-
108
-
109
-
110
-
111
-
112
-
113
-
114
-
115
-
116
-
117
-
118
-
119
-
120
-
121
-
122
-
123
-
124
-
125
-
126
-
127
-
128
-
129
-
130
-
131
-
132
-
133
-
134
-
135
-
136
-
137
-
138
-
139
-
140
-
141
-
142
-
143
-
144
 |
 |

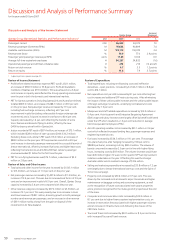
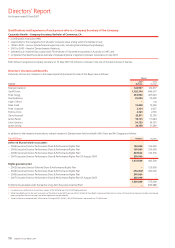
Review of Income Statement
Profit before related income tax expense (PBT) was $1,032.1 million,
an increase of $360.9 million or 53.8 per cent. Profit attributable to
members of Qantas was $719.4 million. This was achieved on a 3.4 per
cent increase in capacity and reflected the strong operating environment
over the year in both the domestic and international markets.
PBT for Qantas operations (including QantasLink and Australian Airlines)
totalled $865.0 million, an increase of $288.1 million or 49.9 per cent
on the prior year. Net passenger revenue increased by 11.5 per cent,
including fuel surcharge recoveries, reflecting a 8.7 per cent
improvement in yield (excluding unfavourable foreign exchange rate
movements) and a 3.4 point increase in seat factor to 80.6 per cent.
Capacity decreased by 1.4 per cent reflecting the transfer of some
trans-Tasman and domestic flying to Jetstar, offset by the new
Q400 turboprop aircraft within QantasLink.
Jetstar recorded a PBT result of $87.4 million, an increase of $75.1 million,
which included $28.0 million of start-up costs (2006: $14.2 million).
Excluding these costs, Jetstar’s PBT was $115.4 million, an increase of
$88.9 million on the prior year. PBT improved as a result of a 42.9 per
cent increase in domestic passenger revenue and the successful launch of
Jetstar International, offset by increased fuel costs and higher lease costs
reflecting the transition to an all A320-200 fleet. Jetstar’s passenger
revenue exceeded $1 billion for the first time this year.
PBT for non-flying businesses was $79.7 million, a decrease of $2.3
million or 2.8 per cent.
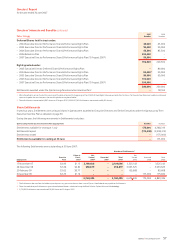
Review of Sales and Other Income
Total sales and other income for the year increased by $1,505.1 million
to $15.2 billion, an increase of 11.0 per cent on the prior year.
Net passenger revenue increased by $1,407.9 million to $11.9 billion, an
increase of 13.4 per cent. This was due to increased seat factor of 2.9 per
cent and an improvement in yield of 6.9 per cent. Overall, Qantas Group
capacity increased by 3.4 per cent compared with the prior year.
Other revenue categories increased by $97.2 million to $3.3 billion, an
increase of 3.1 per cent. This was primarily due to an increase in tours
and travel revenue of $48.1 million, driven by growth in both passenger
numbers and revenue per passenger, and an increase in other revenue
of $69.1 million mainly arising from the gain on disposal of the
investment in Air New Zealand.
•
•
•
•
•
•
•
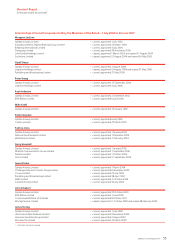
Review of Expenditure
Total expenditure, including net financing costs and ineffective
derivatives – open positions, increased by $1,144.2 million or 8.8 per
cent to $14.1 billion.
Net expenditure cost per ASK increased by 8.1 per cent reflecting fuel
cost increases and additional SFP restructuring costs. After eliminating
the impact of these unfavourable increases and the unfavourable impact
of foreign exchange movements, underlying normalised unit costs
decreased by 1.9 per cent.
Manpower and staff related expenditure increased by $13.0 million or
0.4 per cent. Activity growth and Enterprise Bargaining Agreement
(EBA) wage and salary increases were largely offset by benefits delivered
under the SFP which resulted in a 1.6 per cent reduction in average
full-time equivalent employees (FTEs).
Aircraft operating variable costs increased by $91.1 million or 3.6 per
cent which reflected increased landing fees, passenger expenses and
engineering material costs.
Fuel costs increased by $534.5 million or 19.1 per cent. The average
into-plane fuel price after hedging increased by 19.8 per cent to
$88.89 per barrel, increasing costs by $555.0 million. The volume of
barrels consumed increased by 2.9 per cent in line with higher flying
hours, increasing costs by $93 million. The volume increase would have
been $45 million higher if it were not for specific SFP fuel improvement
initiatives undertaken in the year. Offsetting this was the stronger
Australian dollar which resulted in savings of $126 million.
Selling and marketing expenditure increased by $33.8 million or 7.2 per
cent largely due to Jetstar International start-up costs and the Spirit of
Tomorrow campaign.
Property costs increased by $30.4 million or 9.5 per cent. This was
driven by the increased rents at domestic airport terminals and higher
maintenance on baggage sorting and screening equipment, as well
as the recognition of future costs associated with vacant properties
and a provision recognised for the make-good of properties at the end
of the lease.
Computer and communication costs increased by $39.5 million or
8.1 per cent due to higher finance system implementation costs, an
increase in reservation fees associated with higher passenger volumes
and an increase in infrastructure costs following the closure of the
CBD Data Centre.
Tours and Travel costs increased by $50.5 million or 8.5 per cent in line
with increased Tours and Travel revenue.
•
•
•
•
•
•
•
•
•
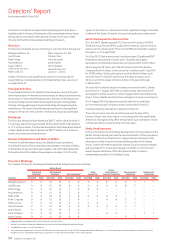
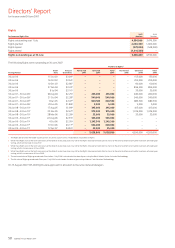
Discussion and Analysis of the Income Statement
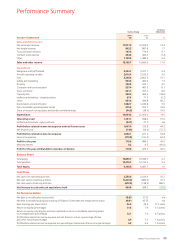
Qantas Group Operational Statistics and Performance Indicators1
Qantas Group
Increase/
(Decrease)
Unit 2007 2006 %
Passengers carried 000 36,449 34,075 7.0
Revenue passenger kilometres (RPKs) M 97,622 90,899 7.4
Available seat kilometres (ASKs) M 122,119 118 ,070 3.4
Revenue seat factor %79.9 77.0 2.9 points
Passenger yield (passenger revenue per RPK) cents 11.69 10.94 6.9
Average full-time equivalent employees # 34,267 34,832 (1.6)
Operational passenger aircraft fleet at balance date # 213 216 (3) aircraft
Return on total revenue % 4.7 3.5 1.2 points
Return on equity %11.6 7.9 3.7 points
A glossary of terms appears on page 141.
1
50 Qantas |Annual Report 2007
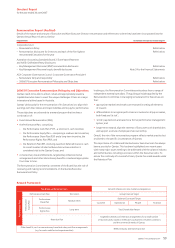
Discussion and Analysis of Performance Summary
for the year ended 30 June 2007