Qantas 2007 Annual Report Download - page 70
Download and view the complete annual report
Please find page 70 of the 2007 Qantas annual report below. You can navigate through the pages in the report by either clicking on the pages listed below, or by using the keyword search tool below to find specific information within the annual report.-
 1
1 -
2
-
3
-
4
-
5
-
6
-
7
-
8
-
9
-
10
-
11
-
12
-
13
-
14
-
15
-
16
-
17
-
18
-
19
-
20
-
21
-
22
-
23
-
24
-
25
-
26
-
27
-
28
-
29
-
30
-
31
-
32
-
33
-
34
-
35
-
36
-
37
-
38
-
39
-
40
-
41
-
42
-
43
-
44
-
45
-
46
-
47
-
48
-
49
-
50
-
51
-
52
-
53
-
54
-
55
-
56
-
57
-
58
-
59
-
 60
60 -
 61
61 -
 62
62 -
 63
63 -
 64
64 -
 65
65 -
 66
66 -
 67
67 -
 68
68 -
 69
69 -
 70
70 -
 71
71 -
 72
72 -
 73
73 -
 74
74 -
 75
75 -
 76
76 -
 77
77 -
 78
78 -
 79
79 -
 80
80 -
81
-
82
-
83
-
84
-
85
-
86
-
87
-
88
-
89
-
90
-
91
-
92
-
93
-
94
-
95
-
96
-
97
-
98
-
99
-
100
-
101
-
102
-
103
-
104
-
105
-
106
-
107
-
108
-
109
-
110
-
111
-
112
-
113
-
114
-
115
-
116
-
117
-
118
-
119
-
120
-
121
-
122
-
123
-
124
-
125
-
126
-
127
-
128
-
129
-
130
-
131
-
132
-
133
-
134
-
135
-
136
-
137
-
138
-
139
-
140
-
141
-
142
-
143
-
144
 |
 |

68 Qantas |Annual Report 2007
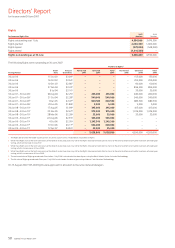
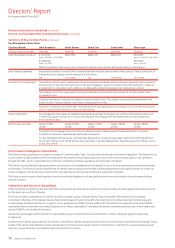
Directors’ Report
for the year ended 30 June 2007
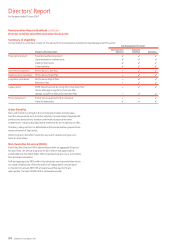
Summary of Performance Conditions
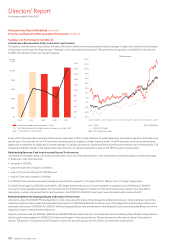
Link between Remuneration Policy and Qantas’ performance
The graph on the left below shows Qantas’ full-year profit before related income tax expense and the percentage of target cash incentives that were paid
to Executives over the past five financial years. The graph on the right below shows Qantas’ TSR performance compared to the S&P/ASX 100 Index and
the MSCI World Airline Index over the past five years.
In line with the Executive Remuneration Philosophy and Objectives, FAR is set with reference to market data and is not related to Qantas’ performance in a
specific year. The outcomes for the PCP (short-term incentive plan) are related to Qantas’ financial results. The PSP outcomes are driven by performance
against the achievement of a Balanced Scorecard relating to Customer, Operational, People and Financial performance (medium-term incentive plan). TSR
(including dividends, changes in the Qantas share price and return of capital if applicable) is used for the PRP (long-term incentive plan).
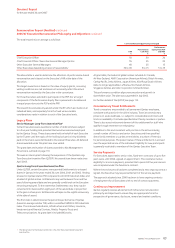
Relationship Between Cash Incentives and Qantas’ Performance
As indicated in the graph above, cash incentives were paid in four out of the past five years. In line with Qantas’ achievement against its financial targets
in these years, cash incentives were:
not paid for 2002/03;
paid at 110 per cent of target for 2003/04;
paid at 100 per cent of target for 2004/05; and
paid at 73 per cent of target for 2005/06.
The 2006/07 cash incentives were paid, having been approved for payment on 15 August 2007, at 186 per cent of ‘at target’ opportunity.
For 2002/03 and again for 2005/06 and 2006/07, a PBT target determined the pool of money available for payment and in 2003/04 and 2004/05
the pool of money available was subject to the achievement of a RoTGA target for members of the Executive Team and a target of earnings before
depreciation, rentals, interest and tax for other Executives. For 2002/03 to 2004/05, these targets were calculated under previous GAAP.
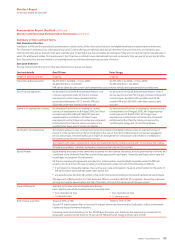
Relationship Between Employee Equity and Qantas’ Performance
Allocations under the 2006/07 PSP are dependent on the corporate performance of Qantas against a Balanced Scorecard. One hundred per cent of the
target level of performance shares were awarded to Executives in 2003/04 and 2004/05 and 95 per cent of the target level of performance shares were
awarded to Executives in 2005/06. For 2006/07, the Board assessed 80 per cent achievement on the Balanced Scorecard and awarded 80 per cent of the
target level of performance shares to Executives.
Reward outcomes under the 2004/05, 2005/06 and 2006/07 PRP are linked to Qantas’ performance because the vesting of these Rights is dependent on
Qantas’ performance against the S&P/ASX 100 Index and a basket of international airlines. This performance hurdle rewards Qantas’ Executives for
Qantas’ TSR growth in comparison to the TSR growth rates of its two peer groups over the three to five year performance period.
•
•
•
•
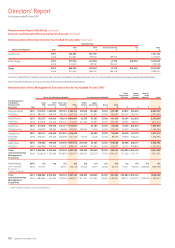
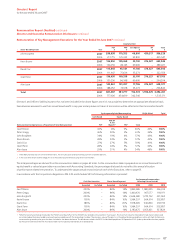
Remuneration Report (Audited) continued
Director and Executive Remuneration Disclosures continued
$200
$400
$600
$800
$1,000
$ million
$1,200
$0
2007
2006200520042003
Profit before related income tax expense – A-IFRS
Profit from ordinary activities before income tax expense – previous GAAP
% of target cash incentives paid
200%
180%
160%
140%
120%
100%
80%
60%
40%
20%
0%
Qantas
S&P/ASX 100 Index
MSCI World Airline Index
Source: Bloomberg
TSR Performance
-45%
-30%
-15%
0%
15%
30%
45%
60%
75%
90%
105%
120%
135%
Jun 02 Dec 02 Jun 03 Dec 03 Jun 04 Dec 04 Jun 05 Dec 05 Jun 06 Dec 06 Jun 07