Qantas 2007 Annual Report Download - page 123
Download and view the complete annual report
Please find page 123 of the 2007 Qantas annual report below. You can navigate through the pages in the report by either clicking on the pages listed below, or by using the keyword search tool below to find specific information within the annual report.-
 1
1 -
2
-
3
-
4
-
5
-
6
-
7
-
8
-
9
-
10
-
11
-
12
-
13
-
14
-
15
-
16
-
17
-
18
-
19
-
20
-
21
-
22
-
23
-
24
-
25
-
26
-
27
-
28
-
29
-
30
-
31
-
32
-
33
-
34
-
35
-
36
-
37
-
38
-
39
-
40
-
41
-
42
-
43
-
44
-
45
-
46
-
47
-
48
-
49
-
50
-
51
-
52
-
53
-
54
-
55
-
56
-
57
-
58
-
59
-
60
-
61
-
62
-
63
-
64
-
65
-
66
-
67
-
68
-
69
-
70
-
71
-
72
-
73
-
74
-
75
-
76
-
77
-
78
-
79
-
80
-
81
-
82
-
83
-
84
-
85
-
86
-
87
-
88
-
89
-
90
-
91
-
92
-
93
-
94
-
95
-
96
-
97
-
98
-
99
-
100
-
101
-
102
-
103
-
104
-
105
-
106
-
107
-
108
-
109
-
110
-
111
-
112
-
 113
113 -
 114
114 -
 115
115 -
 116
116 -
 117
117 -
 118
118 -
 119
119 -
 120
120 -
 121
121 -
 122
122 -
 123
123 -
 124
124 -
 125
125 -
 126
126 -
 127
127 -
 128
128 -
 129
129 -
 130
130 -
 131
131 -
 132
132 -
 133
133 -
134
-
135
-
136
-
137
-
138
-
139
-
140
-
141
-
142
-
143
-
144
 |
 |

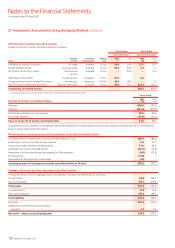
121Qantas |Annual Report 2007
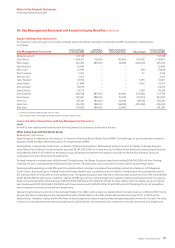
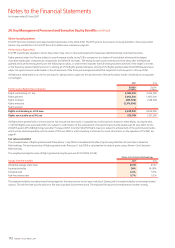
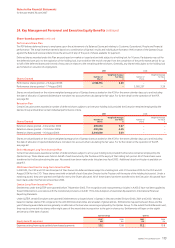
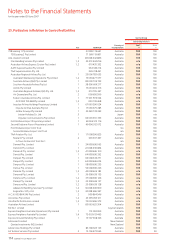
Notes to the Financial Statements
for the year ended 30 June 2007
Qantas Group
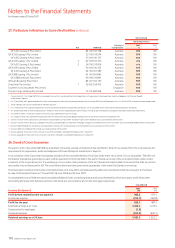
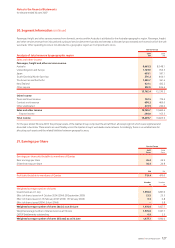
Commitments 2007
$M
2006
$M
Share of jointly controlled entities’ capital expenditure commitments contracted for 24.5 1.9
Share of jointly controlled entities’ non-capital expenditure commitments contracted for 393.9 172.2
Share of jointly controlled entities’ commitments 418.4 174.1
Contingent liabilities
Share of jointly controlled entities’ contingent liabilities 28.5 35.1
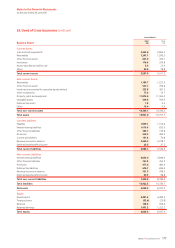
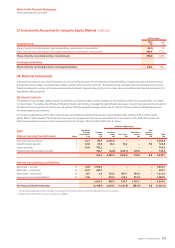
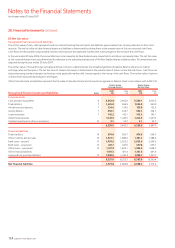
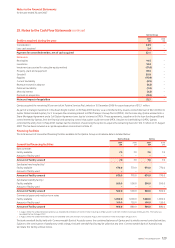
28. Financial Instruments
A financial instrument is any contract that gives rise to both a financial asset of one entity and a financial liability or equity instrument of another entity.
The Qantas Group is subject to interest rate, foreign currency, fuel price and credit risks. The Qantas Group manages these risk exposures using various
financial instruments, using a set of policies approved by the Board. Qantas Group policy is not to enter, issue or hold derivative financial instruments for
speculative trading purposes.
(A) Interest rate risk
The Qantas Group manages interest rate risk by reference to a duration target, being a measure of the sensitivity of the borrowing portfolio to changes
in interest rates. The relative mix of fixed and floating interest rate funding is managed by using interest rate swaps, forward rate agreements and options.
The Qantas Group’s exposure to interest rate risk and the effective weighted average interest rate for classes of financial assets and liabilities exposed
to interest rates are set out below.
For the year ended 30 June 2007, Other financial assets and liabilities included financial instruments hedging debt totalling $195.6 million (asset)
(2006: $453.7 million (asset)). These financial instruments are recognised at fair value or amortised cost in accordance with AASB 139. Interest rate
financial instruments are shown net of impairment losses for the year of $70.6 million (2006: $22.4 million).
Fixed Rate Maturing in:
2007
Interest-earning financial assets Notes
Weighted
Average
Interest Rate
% pa
Floating
Rate
$M
Less than
1 Year
$M
1 to 5 Years
$M
More than
5 Years
$M
Non
Interest-
Bearing
$M
Total
$M
Cash and cash equivalents 6 6.21 80.9 3,282.0 – – – 3,362.9
Aircraft security deposits 7 6.84 33.4 66.6 14.6 – 9.8 124.4
Loans receivable 7 8.00 142.2 – – – – 142.2
Financial instruments relating to debt1156.1 (67.6) (312.7) 419.8 – 195.6
412.6 3,281.0 (298.1) 419.8 9.8 3,825.1
Interest-bearing financial liabilities
Bank loans – secured215 3.89 1,976.5 – – – – 1,976.5
Bank loans – unsecured215 6.97 627.7 – – – – 627.7
Other loans – unsecured215 7.61 6.5 154.3 457.7 793.4 – 1,411.9
Lease and hire purchase liabilities215 7.86 – 472.2 276.0 310.3 – 1,058.5
2,610.7 626.5 733.7 1,103.7 – 5,074.6
Net financial (liabilities)/assets (2,198.1) 2,654.5 (1,031.8) (683.9) 9.8 (1,249.5)
Interest receivable/payable has been included in the calculation of the effective interest rate of the underlying financial asset or liability.
Recognised financial liability carry values are shown pre-hedging.
1
2
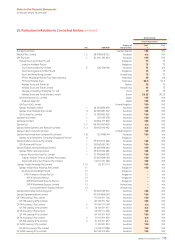
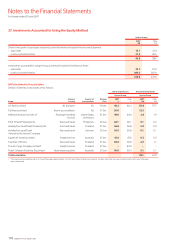
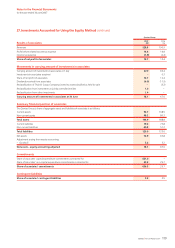
27. Investments Accounted for Using the Equity Method continued