Porsche 2009 Annual Report Download - page 229
Download and view the complete annual report
Please find page 229 of the 2009 Porsche annual report below. You can navigate through the pages in the report by either clicking on the pages listed below, or by using the keyword search tool below to find specific information within the annual report.-
 1
1 -
2
-
3
-
4
-
5
-
6
-
7
-
8
-
9
-
10
-
11
-
12
-
13
-
14
-
15
-
16
-
17
-
18
-
19
-
20
-
21
-
22
-
23
-
24
-
25
-
26
-
27
-
28
-
29
-
30
-
31
-
32
-
33
-
34
-
35
-
36
-
37
-
38
-
39
-
40
-
41
-
42
-
43
-
44
-
45
-
46
-
47
-
48
-
49
-
50
-
51
-
52
-
53
-
54
-
55
-
56
-
57
-
58
-
59
-
60
-
61
-
62
-
63
-
64
-
65
-
66
-
67
-
68
-
69
-
70
-
71
-
72
-
73
-
74
-
75
-
76
-
77
-
78
-
79
-
80
-
81
-
82
-
83
-
84
-
85
-
86
-
87
-
88
-
89
-
90
-
91
-
92
-
93
-
94
-
95
-
96
-
97
-
98
-
99
-
100
-
101
-
102
-
103
-
104
-
105
-
106
-
107
-
108
-
109
-
110
-
111
-
112
-
113
-
114
-
115
-
116
-
117
-
118
-
119
-
120
-
121
-
122
-
123
-
124
-
125
-
126
-
127
-
128
-
129
-
130
-
131
-
132
-
133
-
134
-
135
-
136
-
137
-
138
-
139
-
140
-
141
-
142
-
143
-
144
-
145
-
146
-
147
-
148
-
149
-
150
-
151
-
152
-
153
-
154
-
155
-
156
-
157
-
158
-
159
-
160
-
161
-
162
-
163
-
164
-
165
-
166
-
167
-
168
-
169
-
170
-
171
-
172
-
173
-
174
-
175
-
176
-
177
-
178
-
179
-
180
-
181
-
182
-
183
-
184
-
185
-
186
-
187
-
188
-
189
-
190
-
191
-
192
-
193
-
194
-
195
-
196
-
197
-
198
-
199
-
200
-
201
-
202
-
203
-
204
-
205
-
206
-
207
-
208
-
209
-
210
-
211
-
212
-
213
-
214
-
215
-
216
-
217
-
218
-
 219
219 -
 220
220 -
 221
221 -
 222
222 -
 223
223 -
 224
224 -
 225
225 -
 226
226 -
 227
227 -
 228
228 -
 229
229 -
 230
230 -
 231
231 -
 232
232 -
 233
233 -
 234
234 -
 235
235 -
 236
236 -
 237
237 -
 238
238 -
 239
239 -
240
-
241
-
242
-
243
-
244
-
245
-
246
-
247
-
248
-
249
-
250
-
251
-
252
-
253
-
254
-
255
-
256
-
257
-
258
-
259
-
260
-
261
-
262
-
263
-
264
-
265
-
266
-
267
-
268
-
269
-
270
-
271
-
272
-
273
-
274
-
275
 |
 |
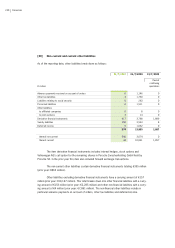
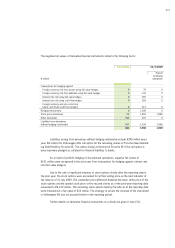
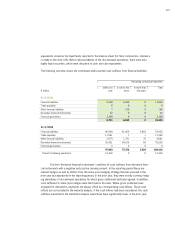
229
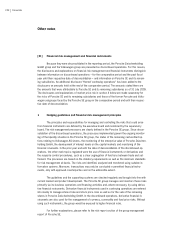
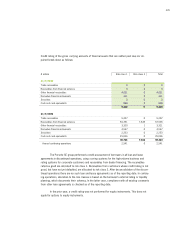
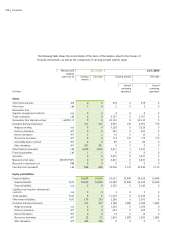
motive division. The interest rate and stock price risk of continuing operations were presented
under automotive in the prior year.
Before deconsolidation of the discontinued operations, currency and interest rate risks in
financial services were valued using a value-at-risk model. Market price risks in the automotive
division for interest rate and currency hedges and the investment risks associated with asset man-
agement within those operations largely were calculated using a sensitivity analysis, and a value-at-
risk model was used for stock price risks.
In the value-at-risk calculation, a historical simulation is used to determine the potential
change in market price. The sensitivity analysis calculates the effect on equity and profit or loss by
modifying risk variables within the respective market risk. The value at risk shows the potential
future loss of a certain portfolio over a predefined period of time (retention period) with certain
probabilities which are not likely to be exceeded. The degree of risk does not, however, give any
information about the distribution and anticipated loss, if it is actually exceeded.
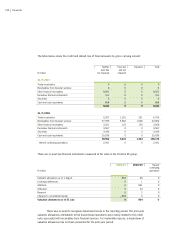
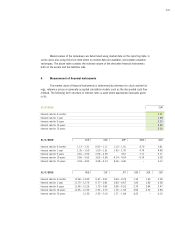
4.2 Market price risks in continuing operations
4.2.1 Interest rate risk
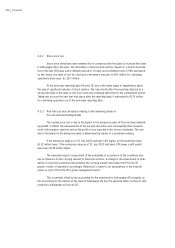
The interest rate risk results from changes in market interest rates. This affects the current
interest result for short-term deposits and medium- and long-term variable-rate liabilities, but can
equally impact on the market value recognized for fixed-interest receivables and liabilities. Interest
contracts are entered into to hedge the variable-rate liabilities.
Interest rate risks within the meaning of IFRS 7 are determined using sensitivity analyses.
The effects of the risk variables in the form of market rates of interest on the financial result and on
equity are presented. As in the prior year, an increase in the market interest rates by 100 base
points as of 31 July 2010 would not have affected equity. Likewise, a decrease in the market inter-
est rates by 50 base points as of 31 July 2010 would not have affected equity, as in the prior year.
If market interest rates had been valued 100 base points higher as of 31 July 2010, profit would
have been €7 million higher (prior year: €57 million lower). If market interest rates had been valued
50 base points lower as of 31 July 2010, profit of continuing operations would have been €0 million
lower (prior year: if market interest rates had been 100 base points lower as of 31 July 2009, profit
of continuing operations would have been €57 million higher).