Porsche 2009 Annual Report Download - page 125
Download and view the complete annual report
Please find page 125 of the 2009 Porsche annual report below. You can navigate through the pages in the report by either clicking on the pages listed below, or by using the keyword search tool below to find specific information within the annual report.-
 1
1 -
2
-
3
-
4
-
5
-
6
-
7
-
8
-
9
-
10
-
11
-
12
-
13
-
14
-
15
-
16
-
17
-
18
-
19
-
20
-
21
-
22
-
23
-
24
-
25
-
26
-
27
-
28
-
29
-
30
-
31
-
32
-
33
-
34
-
35
-
36
-
37
-
38
-
39
-
40
-
41
-
42
-
43
-
44
-
45
-
46
-
47
-
48
-
49
-
50
-
51
-
52
-
53
-
54
-
55
-
56
-
57
-
58
-
59
-
60
-
61
-
62
-
63
-
64
-
65
-
66
-
67
-
68
-
69
-
70
-
71
-
72
-
73
-
74
-
75
-
76
-
77
-
78
-
79
-
80
-
81
-
82
-
83
-
84
-
85
-
86
-
87
-
88
-
89
-
90
-
91
-
92
-
93
-
94
-
95
-
96
-
97
-
98
-
99
-
100
-
101
-
102
-
103
-
104
-
105
-
106
-
107
-
108
-
109
-
110
-
111
-
112
-
113
-
114
-
 115
115 -
 116
116 -
 117
117 -
 118
118 -
 119
119 -
 120
120 -
 121
121 -
 122
122 -
 123
123 -
 124
124 -
 125
125 -
 126
126 -
 127
127 -
 128
128 -
 129
129 -
 130
130 -
 131
131 -
 132
132 -
 133
133 -
 134
134 -
 135
135 -
136
-
137
-
138
-
139
-
140
-
141
-
142
-
143
-
144
-
145
-
146
-
147
-
148
-
149
-
150
-
151
-
152
-
153
-
154
-
155
-
156
-
157
-
158
-
159
-
160
-
161
-
162
-
163
-
164
-
165
-
166
-
167
-
168
-
169
-
170
-
171
-
172
-
173
-
174
-
175
-
176
-
177
-
178
-
179
-
180
-
181
-
182
-
183
-
184
-
185
-
186
-
187
-
188
-
189
-
190
-
191
-
192
-
193
-
194
-
195
-
196
-
197
-
198
-
199
-
200
-
201
-
202
-
203
-
204
-
205
-
206
-
207
-
208
-
209
-
210
-
211
-
212
-
213
-
214
-
215
-
216
-
217
-
218
-
219
-
220
-
221
-
222
-
223
-
224
-
225
-
226
-
227
-
228
-
229
-
230
-
231
-
232
-
233
-
234
-
235
-
236
-
237
-
238
-
239
-
240
-
241
-
242
-
243
-
244
-
245
-
246
-
247
-
248
-
249
-
250
-
251
-
252
-
253
-
254
-
255
-
256
-
257
-
258
-
259
-
260
-
261
-
262
-
263
-
264
-
265
-
266
-
267
-
268
-
269
-
270
-
271
-
272
-
273
-
274
-
275
 |
 |

125
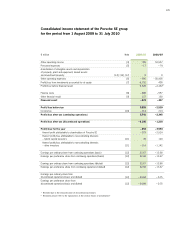
1 Restated due to the reclassification of discontinued operations
2 Restated; please refer to the explanations in the section “Basis of presentation”
Consolidated income statement of the Porsche SE group
for the period from 1 August 2009 to 31 July 2010
€ million Note 2009/10 2008/091
Other operating income [3] 709 52,957
Personnel expenses [5] – 17 – 74
Amortization of intangible assets and depreciation
of property, plant and equipment, leased assets
and investment property [14], [15], [17] 0 0
Other operating expenses [6] – 956 – 55,435
Profit/loss from investments accounted for at equity [7] 6,792 400
Profit/loss before financial result 6,528 – 2,1522
Finance costs [8] – 800 – 557
Other financial result [9] 127 150
Financial result – 673 – 407
Profit/loss before tax 5,855 – 2,559
Income tax [10] – 114 214
Profit/loss after tax (continuing operations) 5,741 – 2,345
Profit/loss after tax (discontinued operations) – 6,195 – 1,218
Profit/loss for the year – 454 – 3,563
thereof profit attributable to shareholders of Porsche SE – 379 – 2,524
thereof profit/loss attributable to non-controlling interests
– hybrid capital investors [11] 39 103
thereof profit/loss attributable to non-controlling interests
– other investors [11] – 114 – 1,142
Earnings per ordinary share from continuing operations (basic) [12] 32.67 – 13.68
Earnings per preference share from continuing operations (basic) [12] 32.68 – 13.67
Earnings per ordinary share from continuing operations (diluted) [12] 32.67 – 13.68
Earnings per preference share from continuing operations (diluted) [12] 32.68 – 13.67
Earnings per ordinary share from
discontinued operations (basic and diluted) [12] – 34.84 – 0.75
Earnings per preference share from
discontinued operations (basic and diluted) [12] – 34.84 – 0.75