Porsche 2009 Annual Report Download - page 227
Download and view the complete annual report
Please find page 227 of the 2009 Porsche annual report below. You can navigate through the pages in the report by either clicking on the pages listed below, or by using the keyword search tool below to find specific information within the annual report.-
 1
1 -
2
-
3
-
4
-
5
-
6
-
7
-
8
-
9
-
10
-
11
-
12
-
13
-
14
-
15
-
16
-
17
-
18
-
19
-
20
-
21
-
22
-
23
-
24
-
25
-
26
-
27
-
28
-
29
-
30
-
31
-
32
-
33
-
34
-
35
-
36
-
37
-
38
-
39
-
40
-
41
-
42
-
43
-
44
-
45
-
46
-
47
-
48
-
49
-
50
-
51
-
52
-
53
-
54
-
55
-
56
-
57
-
58
-
59
-
60
-
61
-
62
-
63
-
64
-
65
-
66
-
67
-
68
-
69
-
70
-
71
-
72
-
73
-
74
-
75
-
76
-
77
-
78
-
79
-
80
-
81
-
82
-
83
-
84
-
85
-
86
-
87
-
88
-
89
-
90
-
91
-
92
-
93
-
94
-
95
-
96
-
97
-
98
-
99
-
100
-
101
-
102
-
103
-
104
-
105
-
106
-
107
-
108
-
109
-
110
-
111
-
112
-
113
-
114
-
115
-
116
-
117
-
118
-
119
-
120
-
121
-
122
-
123
-
124
-
125
-
126
-
127
-
128
-
129
-
130
-
131
-
132
-
133
-
134
-
135
-
136
-
137
-
138
-
139
-
140
-
141
-
142
-
143
-
144
-
145
-
146
-
147
-
148
-
149
-
150
-
151
-
152
-
153
-
154
-
155
-
156
-
157
-
158
-
159
-
160
-
161
-
162
-
163
-
164
-
165
-
166
-
167
-
168
-
169
-
170
-
171
-
172
-
173
-
174
-
175
-
176
-
177
-
178
-
179
-
180
-
181
-
182
-
183
-
184
-
185
-
186
-
187
-
188
-
189
-
190
-
191
-
192
-
193
-
194
-
195
-
196
-
197
-
198
-
199
-
200
-
201
-
202
-
203
-
204
-
205
-
206
-
207
-
208
-
209
-
210
-
211
-
212
-
213
-
214
-
215
-
216
-
 217
217 -
 218
218 -
 219
219 -
 220
220 -
 221
221 -
 222
222 -
 223
223 -
 224
224 -
 225
225 -
 226
226 -
 227
227 -
 228
228 -
 229
229 -
 230
230 -
 231
231 -
 232
232 -
 233
233 -
 234
234 -
 235
235 -
 236
236 -
 237
237 -
238
-
239
-
240
-
241
-
242
-
243
-
244
-
245
-
246
-
247
-
248
-
249
-
250
-
251
-
252
-
253
-
254
-
255
-
256
-
257
-
258
-
259
-
260
-
261
-
262
-
263
-
264
-
265
-
266
-
267
-
268
-
269
-
270
-
271
-
272
-
273
-
274
-
275
 |
 |
227
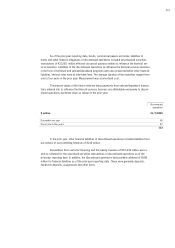
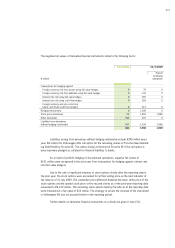
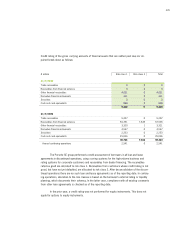
equivalents comprise the liquid funds reported in the balance sheet (for their composition, reference
is made to the note [13]). Before deconsolidation of the discontinued operations, there were also
highly liquid securities, which were allocated to cash and cash equivalents.
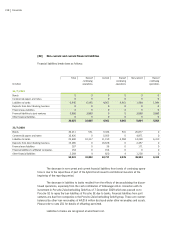
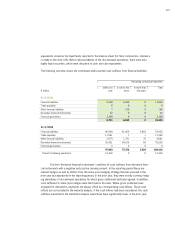
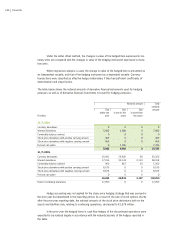
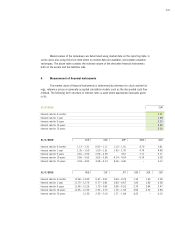
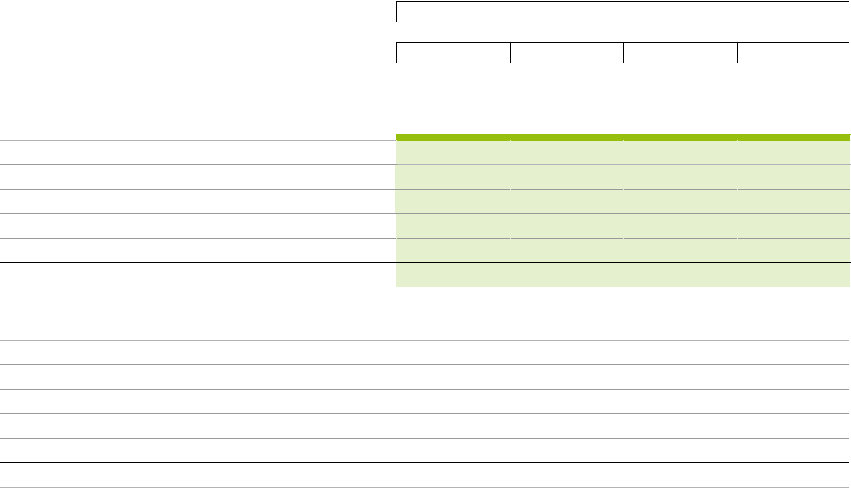
The following overview shows the contractual undiscounted cash outflows from financial liabilities:
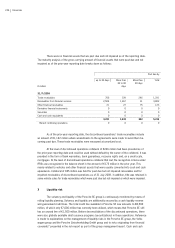
The item ‘derivative financial instruments’ combines all cash outflows from derivative finan-
cial instruments with a negative and positive carrying amount. In the reporting period these are
interest hedges as well as effects from the share price hedging strategy that was pursued in the
prior year but abandoned in the reporting period. In the prior year, they were mostly currency hedg-
ing derivatives of discontinued operations for which gross settlement had been agreed. In addition,
cash outflows for share price hedges were disclosed in this item. Where gross settlement was
arranged for derivatives, payments are always offset by corresponding cash inflows. These cash
inflows are not included in the maturity analysis. If the cash inflows had been considered, the cash
outflows presented in the maturities analysis would have been significantly lower in the prior year.
Remaining contractual maturities
within one in one to five in more than Total
€ million year years five years
31/7/2010
Financial liabilities 5,418 6,435 0 11,853
Trade payables 6 0 0 6
Other financial liabilities 7 149 0 156
Derivative financial instruments 22 0 0 22
Financial guarantees 3,248 0 0 3,248
8,701 6,584 0 15,285
31/7/2009
Financial liabilities 46,984 41,469 5,483 93,936
Trade payables 11,541 7 1 11,549
Other financial liabilities 2,974 1,791 76 4,841
Derivative financial instruments 36,421 34,105 64 70,590
Financial guarantees 0 0 0 0
97,920 77,372 5,624 180,916
thereof continuing operations 13,332 0 0 13,332