Porsche 2009 Annual Report Download - page 188
Download and view the complete annual report
Please find page 188 of the 2009 Porsche annual report below. You can navigate through the pages in the report by either clicking on the pages listed below, or by using the keyword search tool below to find specific information within the annual report.-
 1
1 -
2
-
3
-
4
-
5
-
6
-
7
-
8
-
9
-
10
-
11
-
12
-
13
-
14
-
15
-
16
-
17
-
18
-
19
-
20
-
21
-
22
-
23
-
24
-
25
-
26
-
27
-
28
-
29
-
30
-
31
-
32
-
33
-
34
-
35
-
36
-
37
-
38
-
39
-
40
-
41
-
42
-
43
-
44
-
45
-
46
-
47
-
48
-
49
-
50
-
51
-
52
-
53
-
54
-
55
-
56
-
57
-
58
-
59
-
60
-
61
-
62
-
63
-
64
-
65
-
66
-
67
-
68
-
69
-
70
-
71
-
72
-
73
-
74
-
75
-
76
-
77
-
78
-
79
-
80
-
81
-
82
-
83
-
84
-
85
-
86
-
87
-
88
-
89
-
90
-
91
-
92
-
93
-
94
-
95
-
96
-
97
-
98
-
99
-
100
-
101
-
102
-
103
-
104
-
105
-
106
-
107
-
108
-
109
-
110
-
111
-
112
-
113
-
114
-
115
-
116
-
117
-
118
-
119
-
120
-
121
-
122
-
123
-
124
-
125
-
126
-
127
-
128
-
129
-
130
-
131
-
132
-
133
-
134
-
135
-
136
-
137
-
138
-
139
-
140
-
141
-
142
-
143
-
144
-
145
-
146
-
147
-
148
-
149
-
150
-
151
-
152
-
153
-
154
-
155
-
156
-
157
-
158
-
159
-
160
-
161
-
162
-
163
-
164
-
165
-
166
-
167
-
168
-
169
-
170
-
171
-
172
-
173
-
174
-
175
-
176
-
177
-
 178
178 -
 179
179 -
 180
180 -
 181
181 -
 182
182 -
 183
183 -
 184
184 -
 185
185 -
 186
186 -
 187
187 -
 188
188 -
 189
189 -
 190
190 -
 191
191 -
 192
192 -
 193
193 -
 194
194 -
 195
195 -
 196
196 -
 197
197 -
 198
198 -
199
-
200
-
201
-
202
-
203
-
204
-
205
-
206
-
207
-
208
-
209
-
210
-
211
-
212
-
213
-
214
-
215
-
216
-
217
-
218
-
219
-
220
-
221
-
222
-
223
-
224
-
225
-
226
-
227
-
228
-
229
-
230
-
231
-
232
-
233
-
234
-
235
-
236
-
237
-
238
-
239
-
240
-
241
-
242
-
243
-
244
-
245
-
246
-
247
-
248
-
249
-
250
-
251
-
252
-
253
-
254
-
255
-
256
-
257
-
258
-
259
-
260
-
261
-
262
-
263
-
264
-
265
-
266
-
267
-
268
-
269
-
270
-
271
-
272
-
273
-
274
-
275
 |
 |

188 Financials
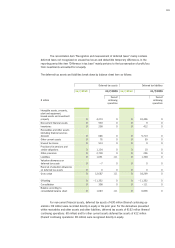
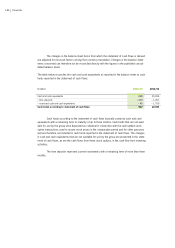
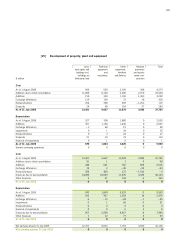
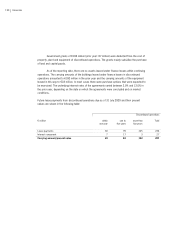
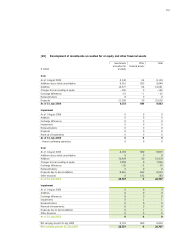
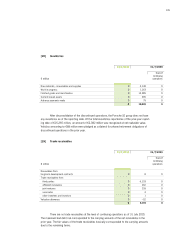
Intangible assets developed as follows:
Goodwill Capitalized Capitalized Brands Other Total
€ million
development
costs for
products
currently in
use
costs for
products
under
development
intangible
assets
Cost
As of 1 August 2008 11 261 14 0 539 825
Additions due to initial consolidation 10,368 6,165 2,839 10,852 2,201 32,425
Additions 0 192 968 0 273 1,433
Exchange differences 70 154 39 9 21 293
Reclassifications 0 604 – 604 0 – 20 – 20
Disposals 0 20 36 0 379 435
As of 31 July 2009 10,449 7,356 3,220 10,861 2,635 34,521
Amortization
As of 1 August 2008 0 142 0 0 324 466
Additions 0 895 0 0 681 1,576
Exchange differences 0 95 0 0 8 103
Impairments 0 64 81 0 0 145
Reclassifications 0 0 0 0 – 2 – 2
Disposals 0 20 35 0 378 433
As of 31 July 2009 0 1,176 46 0 633 1,855
thereof continuing operations 0 0 0 0 0 0
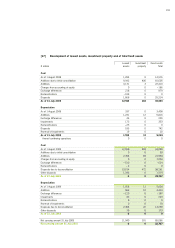
Cost
As of 1 August 2009 10,449 7,356 3,220 10,861 2,635 34,521
Additions due to initial consolidation 1 0 0 0 0 1
Additions 0 161 763 0 127 1,051
Exchange differences 0 – 18 – 38 28 14 – 14
Reclassifications 0 251 – 251 0 5 5
Disposals due to deconsolidation 10,450 7,743 3,691 10,889 2,775 35,548
Other disposals 0 7 3 0 6 16
As of 31 July 2010 0 0 0 0 0 0
Amortization
As of 1 August 2009 0 1,176 46 0 633 1,855
Additions 0 725 0 0 246 971
Exchange differences 0 – 33 – 3 0 4 – 32
Impairments 0 47 12 0 69 128
Reclassifications 0 6 – 6 0 0 0
Reversal of impairments 0 0 2 0 0 2
Disposals due to deconsolidation 0 1,920 44 0 949 2,913
Other disposals 0 1 3 0 3 7
As of 31 July 2010 0 0 0 0 0 0
Net carrying amount 31 July 2009 10,449 6,180 3,174 10,861 2,002 32,666
Net carrying amount 31 July 2010 0 0 0 0 0 0