Neiman Marcus 2003 Annual Report Download - page 69
Download and view the complete annual report
Please find page 69 of the 2003 Neiman Marcus annual report below. You can navigate through the pages in the report by either clicking on the pages listed below, or by using the keyword search tool below to find specific information within the annual report.-
 1
1 -
2
-
3
-
4
-
5
-
6
-
7
-
8
-
9
-
10
-
11
-
12
-
13
-
14
-
15
-
16
-
17
-
18
-
19
-
20
-
21
-
22
-
23
-
24
-
25
-
26
-
27
-
28
-
29
-
30
-
31
-
32
-
33
-
34
-
35
-
36
-
37
-
38
-
39
-
40
-
41
-
42
-
43
-
44
-
45
-
46
-
47
-
48
-
49
-
50
-
51
-
52
-
53
-
54
-
55
-
56
-
57
-
58
-
 59
59 -
 60
60 -
 61
61 -
 62
62 -
 63
63 -
 64
64 -
 65
65 -
 66
66 -
 67
67 -
 68
68 -
 69
69 -
 70
70 -
 71
71 -
 72
72 -
 73
73 -
 74
74 -
 75
75 -
 76
76 -
 77
77 -
 78
78 -
 79
79 -
80
-
81
-
82
-
83
-
84
-
85
-
86
-
87
-
88
-
89
-
90
-
91
-
92
-
93
-
94
-
95
-
96
-
97
-
98
-
99
-
100
-
101
-
102
-
103
-
104
-
105
-
106
-
107
-
108
-
109
-
110
-
111
-
112
-
113
-
114
-
115
-
116
-
117
-
118
-
119
-
120
-
121
-
122
-
123
-
124
-
125
-
126
-
127
-
128
-
129
-
130
-
131
-
132
-
133
-
134
-
135
-
136
-
137
-
138
-
139
-
140
-
141
-
142
-
143
-
144
-
145
-
146
-
147
-
148
-
149
-
150
-
151
-
152
-
153
-
154
-
155
-
156
-
157
-
158
-
159
-
160
-
161
-
162
-
163
-
164
-
165
-
166
-
167
-
168
-
169
-
170
-
171
-
172
-
173
-
174
-
175
-
176
-
177
-
178
-
179
-
180
-
181
-
182
-
183
-
184
-
185
-
186
-
187
-
188
-
189
-
190
-
191
-
192
-
193
-
194
-
195
-
196
-
197
-
198
-
199
-
200
-
201
-
202
-
203
-
204
-
205
-
206
-
207
-
208
-
209
-
210
-
211
-
212
-
213
-
214
-
215
-
216
-
217
-
218
-
219
-
220
-
221
-
222
-
223
-
224
-
225
-
226
-
227
-
228
-
229
-
230
-
231
-
232
-
233
-
234
-
235
-
236
-
237
-
238
-
239
-
240
-
241
-
242
-
243
-
244
-
245
-
246
-
247
-
248
-
249
-
250
-
251
-
252
-
253
-
254
-
255
-
256
-
257
-
258
-
259
-
260
-
261
-
262
-
263
-
264
-
265
-
266
-
267
-
268
-
269
-
270
-
271
-
272
-
273
-
274
-
275
-
276
-
277
-
278
-
279
-
280
-
281
-
282
-
283
-
284
-
285
-
286
-
287
-
288
-
289
-
290
-
291
-
292
-
293
-
294
-
295
-
296
-
297
-
298
-
299
-
300
-
301
-
302
-
303
-
304
-
305
-
306
-
307
-
308
-
309
-
310
-
311
-
312
-
313
-
314
-
315
-
316
-
317
-
318
-
319
-
320
-
321
-
322
-
323
-
324
-
325
-
326
-
327
-
328
-
329
-
330
-
331
-
332
-
333
-
334
-
335
-
336
-
337
-
338
-
339
-
340
-
341
-
342
-
343
-
344
-
345
-
346
-
347
-
348
-
349
-
350
-
351
-
352
-
353
-
354
-
355
-
356
-
357
 |
 |

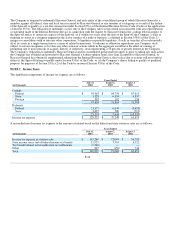
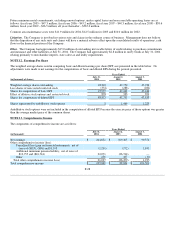
NOTE 15. Quarterly Financial Information (Unaudited)
Year Ended July 31, 2004
(in millions, except for
per share data)
First
Quarter
Second
Quarter
Third
Quarter
Fourth
Quarter Total
Revenues $ 824.9 $ 1,054.1 $ 877.6 $ 789.0 $ 3,545.6
Gross profit $ 316.5 $ 337.0 $ 334.3 $ 236.7 $ 1,224.4
Net earnings $ 56.2 $ 59.2(1)$ 68.8 $ 20.6(2)$ 204.8
Earnings per share:
Basic $ 1.18 $ 1.23 $ 1.43 $ 0.43 $ 4.27
Diluted $ 1.16 $ 1.21 $ 1.40 $ 0.42 $ 4.19
Year Ended August 2, 2003
(in millions, except for
per share data)
First
Quarter
Second
Quarter
Third
Quarter
Fourth
Quarter Total
Revenues $ 734.1 $ 938.5 $ 722.9 $ 702.7 $ 3,098.1
Gross profit 280.2 283.9 259.2 201.3 1,024.5
Earnings before change in accounting
principle 43.3 32.5 41.1 7.2 124.1
Change in accounting principle (14.8)— — — (14.8)
Net earnings $ 28.5 $ 32.5 $ 41.1 $ 7.2 $ 109.3
Basic earnings per share:
Earnings before change in accounting
principle $ 0.91 $ 0.68 $ 0.87 $ 0.15 $ 2.61
Change in accounting principle (0.31)— — — (0.31)
Basic earnings per share $ 0.60 $ 0.68 $ 0.87 $ 0.15 $ 2.30
Diluted earnings per share:
Earnings before change in accounting
principle $ 0.90 $ 0.68 $ 0.87 $ 0.15 $ 2.60
Change in accounting principle (0.31)— — — (0.31)
Diluted earnings per share $ 0.59 $ 0.68 $ 0.87 $ 0.15 $ 2.29
(1) Net earnings for the second quarter of 2004 reflect a $7.5 million net income tax benefit related to favorable settlements
associated with previous state tax filings.
(2) Net earnings for the fourth quarter of 2004 include a $3.9 million pretax impairment charge related to the writedown to fair
value in the net carrying value of the Chef's Catalog tradename intangible asset.
F-30