Neiman Marcus 2003 Annual Report Download - page 41
Download and view the complete annual report
Please find page 41 of the 2003 Neiman Marcus annual report below. You can navigate through the pages in the report by either clicking on the pages listed below, or by using the keyword search tool below to find specific information within the annual report.-
 1
1 -
2
-
3
-
4
-
5
-
6
-
7
-
8
-
9
-
10
-
11
-
12
-
13
-
14
-
15
-
16
-
17
-
18
-
19
-
20
-
21
-
22
-
23
-
24
-
25
-
26
-
27
-
28
-
29
-
30
-
 31
31 -
 32
32 -
 33
33 -
 34
34 -
 35
35 -
 36
36 -
 37
37 -
 38
38 -
 39
39 -
 40
40 -
 41
41 -
 42
42 -
 43
43 -
 44
44 -
 45
45 -
 46
46 -
 47
47 -
 48
48 -
 49
49 -
 50
50 -
 51
51 -
52
-
53
-
54
-
55
-
56
-
57
-
58
-
59
-
60
-
61
-
62
-
63
-
64
-
65
-
66
-
67
-
68
-
69
-
70
-
71
-
72
-
73
-
74
-
75
-
76
-
77
-
78
-
79
-
80
-
81
-
82
-
83
-
84
-
85
-
86
-
87
-
88
-
89
-
90
-
91
-
92
-
93
-
94
-
95
-
96
-
97
-
98
-
99
-
100
-
101
-
102
-
103
-
104
-
105
-
106
-
107
-
108
-
109
-
110
-
111
-
112
-
113
-
114
-
115
-
116
-
117
-
118
-
119
-
120
-
121
-
122
-
123
-
124
-
125
-
126
-
127
-
128
-
129
-
130
-
131
-
132
-
133
-
134
-
135
-
136
-
137
-
138
-
139
-
140
-
141
-
142
-
143
-
144
-
145
-
146
-
147
-
148
-
149
-
150
-
151
-
152
-
153
-
154
-
155
-
156
-
157
-
158
-
159
-
160
-
161
-
162
-
163
-
164
-
165
-
166
-
167
-
168
-
169
-
170
-
171
-
172
-
173
-
174
-
175
-
176
-
177
-
178
-
179
-
180
-
181
-
182
-
183
-
184
-
185
-
186
-
187
-
188
-
189
-
190
-
191
-
192
-
193
-
194
-
195
-
196
-
197
-
198
-
199
-
200
-
201
-
202
-
203
-
204
-
205
-
206
-
207
-
208
-
209
-
210
-
211
-
212
-
213
-
214
-
215
-
216
-
217
-
218
-
219
-
220
-
221
-
222
-
223
-
224
-
225
-
226
-
227
-
228
-
229
-
230
-
231
-
232
-
233
-
234
-
235
-
236
-
237
-
238
-
239
-
240
-
241
-
242
-
243
-
244
-
245
-
246
-
247
-
248
-
249
-
250
-
251
-
252
-
253
-
254
-
255
-
256
-
257
-
258
-
259
-
260
-
261
-
262
-
263
-
264
-
265
-
266
-
267
-
268
-
269
-
270
-
271
-
272
-
273
-
274
-
275
-
276
-
277
-
278
-
279
-
280
-
281
-
282
-
283
-
284
-
285
-
286
-
287
-
288
-
289
-
290
-
291
-
292
-
293
-
294
-
295
-
296
-
297
-
298
-
299
-
300
-
301
-
302
-
303
-
304
-
305
-
306
-
307
-
308
-
309
-
310
-
311
-
312
-
313
-
314
-
315
-
316
-
317
-
318
-
319
-
320
-
321
-
322
-
323
-
324
-
325
-
326
-
327
-
328
-
329
-
330
-
331
-
332
-
333
-
334
-
335
-
336
-
337
-
338
-
339
-
340
-
341
-
342
-
343
-
344
-
345
-
346
-
347
-
348
-
349
-
350
-
351
-
352
-
353
-
354
-
355
-
356
-
357
 |
 |

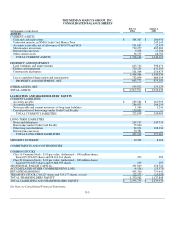
THE NEIMAN MARCUS GROUP, INC.
CONSOLIDATED BALANCE SHEETS
(in thousands, except shares)
July 31,
2004
August 2,
2003
ASSETS
CURRENT ASSETS
Cash and cash equivalents $ 368,367 $ 206,950
Undivided interests in NMG Credit Card Master Trust — 243,145
Accounts receivable, net of allowance of $10,078 and $424 551,687 22,595
Merchandise inventories 720,277 687,062
Deferred income taxes 9,078 17,586
Other current assets 56,757 68,783
TOTAL CURRENT ASSETS 1,706,166 1,246,121
PROPERTY AND EQUIPMENT
Land, buildings and improvements 615,712 598,471
Fixtures and equipment 729,250 631,393
Construction in progress 101,504 110,475
1,446,466 1,340,339
Less accumulated depreciation and amortization 752,694 666,154
PROPERTY AND EQUIPMENT, NET 693,772 674,185
OTHER ASSETS, NET 145,812 114,124
TOTAL ASSETS $ 2,545,750 $ 2,034,430
LIABILITIES AND SHAREHOLDERS' EQUITY
CURRENT LIABILITIES
Accounts payable $ 289,282 $ 262,909
Accrued liabilities 286,833 266,259
Notes payable and current maturities of long-term liabilities 1,563 1,241
Current portion of borrowings under Credit Card Facility 150,000 —
TOTAL CURRENT LIABILITIES 727,678 530,409
LONG-TERM LIABILITIES
Notes and debentures 249,757 249,733
Borrowings under Credit Card Facility 75,000 —
Other long-term liabilities 92,074 108,234
Deferred income taxes 20,381 —
TOTAL LONG-TERM LIABILITIES 437,212 357,967
MINORITY INTEREST 10,298 8,206
COMMITMENTS AND CONTINGENCIES
COMMON STOCKS
Class A Common Stock - $.01 par value; Authorized – 100 million shares;
Issued 29,294,405 shares and 28,214,114 shares 293 282
Class B Common Stock - $.01 par value; Authorized – 100 million shares;
Issued 19,941,833 shares and 19,666,933 shares 199 197
ADDITIONAL PAID-IN CAPITAL 491,849 458,520
ACCUMULATED OTHER COMPREHENSIVE LOSS (4,536) (25,573)
RETAINED EARNINGS 905,330 719,442
TREASURY STOCK (710,227 shares and 524,177 shares, at cost) (22,573)(15,020)
TOTAL SHAREHOLDERS' EQUITY 1,370,562 1,137,848
TOTAL LIABILITIES AND SHAREHOLDERS' EQUITY $ 2,545,750 $ 2,034,430
See Notes to Consolidated Financial Statements.
F-3