Neiman Marcus 2003 Annual Report Download - page 68
Download and view the complete annual report
Please find page 68 of the 2003 Neiman Marcus annual report below. You can navigate through the pages in the report by either clicking on the pages listed below, or by using the keyword search tool below to find specific information within the annual report.-
 1
1 -
2
-
3
-
4
-
5
-
6
-
7
-
8
-
9
-
10
-
11
-
12
-
13
-
14
-
15
-
16
-
17
-
18
-
19
-
20
-
21
-
22
-
23
-
24
-
25
-
26
-
27
-
28
-
29
-
30
-
31
-
32
-
33
-
34
-
35
-
36
-
37
-
38
-
39
-
40
-
41
-
42
-
43
-
44
-
45
-
46
-
47
-
48
-
49
-
50
-
51
-
52
-
53
-
54
-
55
-
56
-
57
-
 58
58 -
 59
59 -
 60
60 -
 61
61 -
 62
62 -
 63
63 -
 64
64 -
 65
65 -
 66
66 -
 67
67 -
 68
68 -
 69
69 -
 70
70 -
 71
71 -
 72
72 -
 73
73 -
 74
74 -
 75
75 -
 76
76 -
 77
77 -
 78
78 -
79
-
80
-
81
-
82
-
83
-
84
-
85
-
86
-
87
-
88
-
89
-
90
-
91
-
92
-
93
-
94
-
95
-
96
-
97
-
98
-
99
-
100
-
101
-
102
-
103
-
104
-
105
-
106
-
107
-
108
-
109
-
110
-
111
-
112
-
113
-
114
-
115
-
116
-
117
-
118
-
119
-
120
-
121
-
122
-
123
-
124
-
125
-
126
-
127
-
128
-
129
-
130
-
131
-
132
-
133
-
134
-
135
-
136
-
137
-
138
-
139
-
140
-
141
-
142
-
143
-
144
-
145
-
146
-
147
-
148
-
149
-
150
-
151
-
152
-
153
-
154
-
155
-
156
-
157
-
158
-
159
-
160
-
161
-
162
-
163
-
164
-
165
-
166
-
167
-
168
-
169
-
170
-
171
-
172
-
173
-
174
-
175
-
176
-
177
-
178
-
179
-
180
-
181
-
182
-
183
-
184
-
185
-
186
-
187
-
188
-
189
-
190
-
191
-
192
-
193
-
194
-
195
-
196
-
197
-
198
-
199
-
200
-
201
-
202
-
203
-
204
-
205
-
206
-
207
-
208
-
209
-
210
-
211
-
212
-
213
-
214
-
215
-
216
-
217
-
218
-
219
-
220
-
221
-
222
-
223
-
224
-
225
-
226
-
227
-
228
-
229
-
230
-
231
-
232
-
233
-
234
-
235
-
236
-
237
-
238
-
239
-
240
-
241
-
242
-
243
-
244
-
245
-
246
-
247
-
248
-
249
-
250
-
251
-
252
-
253
-
254
-
255
-
256
-
257
-
258
-
259
-
260
-
261
-
262
-
263
-
264
-
265
-
266
-
267
-
268
-
269
-
270
-
271
-
272
-
273
-
274
-
275
-
276
-
277
-
278
-
279
-
280
-
281
-
282
-
283
-
284
-
285
-
286
-
287
-
288
-
289
-
290
-
291
-
292
-
293
-
294
-
295
-
296
-
297
-
298
-
299
-
300
-
301
-
302
-
303
-
304
-
305
-
306
-
307
-
308
-
309
-
310
-
311
-
312
-
313
-
314
-
315
-
316
-
317
-
318
-
319
-
320
-
321
-
322
-
323
-
324
-
325
-
326
-
327
-
328
-
329
-
330
-
331
-
332
-
333
-
334
-
335
-
336
-
337
-
338
-
339
-
340
-
341
-
342
-
343
-
344
-
345
-
346
-
347
-
348
-
349
-
350
-
351
-
352
-
353
-
354
-
355
-
356
-
357
 |
 |

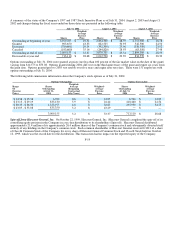
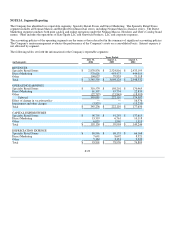
NOTE 14. Segment Reporting
The Company has identified two reportable segments: Specialty Retail Stores and Direct Marketing. The Specialty Retail Stores
segment includes all Neiman Marcus and Bergdorf Goodman retail stores, including Neiman Marcus clearance stores. The Direct
Marketing segment conducts both print catalog and online operations under the Neiman Marcus, Horchow and Chef's Catalog brand
names. Other includes the operations of Kate Spade LLC and Gurwitch Products, LLC and corporate expenses.
The accounting policies of the operating segments are the same as those described in the summary of significant accounting policies.
The Company's senior management evaluates the performance of the Company's assets on a consolidated basis. Interest expense is
not allocated by segment.
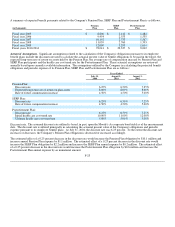
The following tables set forth the information for the Company's reportable segments:
Years Ended
(in thousands)
July 31,
2004
August 2,
2003
August 3,
2002
REVENUES
Specialty Retail Stores $ 2,870,876 $ 2,524,816 $ 2,433,195
Direct Marketing 570,626 493,473 444,019
Other 104,057 79,835 71,118
Total $ 3,545,559 $ 3,098,124 $ 2,948,332
OPERATING EARNINGS
Specialty Retail Stores $ 310,579 $ 198,201 $ 170,465
Direct Marketing 61,307 45,754 22,835
Other (22,797)(21,845)(18,993)
Subtotal 349,089 222,110 174,307
Effect of change in vacation policy — — 16,576
Impairment and other charges (3,853)— (13,233)
Total $ 345,236 $ 222,110 $ 177,650
CAPITAL EXPENDITURES
Specialty Retail Stores $ 98,758 $ 91,293 $ 137,615
Direct Marketing 13,319 6,761 10,118
Other 6,053 1,940 1,513
Total $ 118,130 $ 99,994 $ 149,246
DEPRECIATION EXPENSE
Specialty Retail Stores $ 80,946 $ 68,153 $ 66,168
Direct Marketing 7,691 8,692 8,321
Other 5,164 2,131 2,320
Total $ 93,801 $ 78,976 $ 76,809
F-29