Neiman Marcus 2003 Annual Report Download - page 12
Download and view the complete annual report
Please find page 12 of the 2003 Neiman Marcus annual report below. You can navigate through the pages in the report by either clicking on the pages listed below, or by using the keyword search tool below to find specific information within the annual report.-
 1
1 -
 2
2 -
 3
3 -
 4
4 -
 5
5 -
 6
6 -
 7
7 -
 8
8 -
 9
9 -
 10
10 -
 11
11 -
 12
12 -
 13
13 -
 14
14 -
 15
15 -
 16
16 -
 17
17 -
 18
18 -
 19
19 -
 20
20 -
 21
21 -
 22
22 -
23
-
24
-
25
-
26
-
27
-
28
-
29
-
30
-
31
-
32
-
33
-
34
-
35
-
36
-
37
-
38
-
39
-
40
-
41
-
42
-
43
-
44
-
45
-
46
-
47
-
48
-
49
-
50
-
51
-
52
-
53
-
54
-
55
-
56
-
57
-
58
-
59
-
60
-
61
-
62
-
63
-
64
-
65
-
66
-
67
-
68
-
69
-
70
-
71
-
72
-
73
-
74
-
75
-
76
-
77
-
78
-
79
-
80
-
81
-
82
-
83
-
84
-
85
-
86
-
87
-
88
-
89
-
90
-
91
-
92
-
93
-
94
-
95
-
96
-
97
-
98
-
99
-
100
-
101
-
102
-
103
-
104
-
105
-
106
-
107
-
108
-
109
-
110
-
111
-
112
-
113
-
114
-
115
-
116
-
117
-
118
-
119
-
120
-
121
-
122
-
123
-
124
-
125
-
126
-
127
-
128
-
129
-
130
-
131
-
132
-
133
-
134
-
135
-
136
-
137
-
138
-
139
-
140
-
141
-
142
-
143
-
144
-
145
-
146
-
147
-
148
-
149
-
150
-
151
-
152
-
153
-
154
-
155
-
156
-
157
-
158
-
159
-
160
-
161
-
162
-
163
-
164
-
165
-
166
-
167
-
168
-
169
-
170
-
171
-
172
-
173
-
174
-
175
-
176
-
177
-
178
-
179
-
180
-
181
-
182
-
183
-
184
-
185
-
186
-
187
-
188
-
189
-
190
-
191
-
192
-
193
-
194
-
195
-
196
-
197
-
198
-
199
-
200
-
201
-
202
-
203
-
204
-
205
-
206
-
207
-
208
-
209
-
210
-
211
-
212
-
213
-
214
-
215
-
216
-
217
-
218
-
219
-
220
-
221
-
222
-
223
-
224
-
225
-
226
-
227
-
228
-
229
-
230
-
231
-
232
-
233
-
234
-
235
-
236
-
237
-
238
-
239
-
240
-
241
-
242
-
243
-
244
-
245
-
246
-
247
-
248
-
249
-
250
-
251
-
252
-
253
-
254
-
255
-
256
-
257
-
258
-
259
-
260
-
261
-
262
-
263
-
264
-
265
-
266
-
267
-
268
-
269
-
270
-
271
-
272
-
273
-
274
-
275
-
276
-
277
-
278
-
279
-
280
-
281
-
282
-
283
-
284
-
285
-
286
-
287
-
288
-
289
-
290
-
291
-
292
-
293
-
294
-
295
-
296
-
297
-
298
-
299
-
300
-
301
-
302
-
303
-
304
-
305
-
306
-
307
-
308
-
309
-
310
-
311
-
312
-
313
-
314
-
315
-
316
-
317
-
318
-
319
-
320
-
321
-
322
-
323
-
324
-
325
-
326
-
327
-
328
-
329
-
330
-
331
-
332
-
333
-
334
-
335
-
336
-
337
-
338
-
339
-
340
-
341
-
342
-
343
-
344
-
345
-
346
-
347
-
348
-
349
-
350
-
351
-
352
-
353
-
354
-
355
-
356
-
357
 |
 |

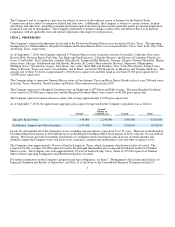
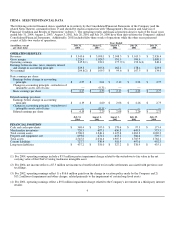
ITEM 6. SELECTED FINANCIAL DATA
The following selected financial data is qualified in its entirety by the Consolidated Financial Statements of the Company (and the
related Notes thereto) contained in Item 15 and should be read in conjunction with "Management's Discussion and Analysis of
Financial Condition and Results of Operations" in Item 7. The operating results and financial position data for each of the fiscal years
ended July 31, 2004, August 2, 2003, August 3, 2002, July 28, 2001 and July 29, 2000 have been derived from the Company's audited
Consolidated Financial Statements. Additionally, 2002 included fifty-three weeks of operations while the other years presented
consist of fifty-two weeks of operations.
Years Ended
(in millions, except
per share data)
July 31,
2004
August 2,
2003
August 3,
2002
July 28,
2001
July 29,
2000
OPERATING RESULTS
Revenues $ 3,545.6 $ 3,098.1 $ 2,948.3 $ 3,015.5 $ 2,926.4
Gross margin 1,224.4 1,024.5 951.0 994.6 1,008.1
Operating earnings 345.2(1) 222.1 177.7(3) 193.6(4) 248.4
Earnings before income taxes, minority interest
and change in accounting principle 329.3 205.8 162.2 178.4 223.0
Net earnings 204.8(2) $ 109.3 $ 99.6 $ 107.5 $ 134.0
Basic earnings per share:
Earnings before change in accounting
principle $ 4.27 $ 2.61 $ 2.10 $ 2.28 $ 2.77
Change in accounting principle - writedown of
intangible assets, net of taxes — (0.31)— —
Basic earnings per share $ 4.27 $ 2.30 $ 2.10 $ 2.28 $ 2.77
Diluted earnings per share:
Earnings before change in accounting
principle $ 4.19 $ 2.60 $ 2.08 $ 2.26 $ 2.75
Change in accounting principle - writedown of
intangible assets, net of taxes — (0.31)— — —
Diluted earnings per share $ 4.19 $ 2.29 $ 2.08 $ 2.26 $ 2.75
July 31,
2004
August 2,
2003
August 3,
2002
July 28,
2001
July 29,
2000
FINANCIAL POSITION
Cash and cash equivalents $ 368.4 $ 207.0 $ 178.6 $ 97.3 $ 175.4
Merchandise inventories 720.3 687.1 656.8 648.9 575.3
Total current assets 1,706.2 1,246.1 1,127.6 1,063.3 1,069.3
Property and equipment, net 693.8 674.2 653.2 586.6 539.7
Total assets 2,545.8 2,034.4 1,907.5 1,785.9 1,762.1
Current liabilities 727.7 530.4 518.5 497.6 492.3
Long-term liabilities $ 437.2 $ 358.0 $ 327.2 $ 338.9 $ 435.1
(1) For 2004, operating earnings include a $3.9 million pretax impairment charge related to the writedown to fair value in the net
carrying value of the Chef's Catalog tradename intangible asset.
(2) For 2004, net income reflects a $7.5 million net income tax benefit related to favorable settlements associated with previous state
tax filings.
(3) For 2002, operating earnings reflect 1) a $16.6 million gain from the change in vacation policy made by the Company and 2)
$13.2 million of impairment and other charges, related primarily to the impairment of certain long-lived assets.
(4) For 2001, operating earnings reflect a $9.8 million impairment charge related to the Company's investment in a third-party internet
retailer.
9