Neiman Marcus 2003 Annual Report Download - page 44
Download and view the complete annual report
Please find page 44 of the 2003 Neiman Marcus annual report below. You can navigate through the pages in the report by either clicking on the pages listed below, or by using the keyword search tool below to find specific information within the annual report.-
 1
1 -
2
-
3
-
4
-
5
-
6
-
7
-
8
-
9
-
10
-
11
-
12
-
13
-
14
-
15
-
16
-
17
-
18
-
19
-
20
-
21
-
22
-
23
-
24
-
25
-
26
-
27
-
28
-
29
-
30
-
31
-
32
-
33
-
 34
34 -
 35
35 -
 36
36 -
 37
37 -
 38
38 -
 39
39 -
 40
40 -
 41
41 -
 42
42 -
 43
43 -
 44
44 -
 45
45 -
 46
46 -
 47
47 -
 48
48 -
 49
49 -
 50
50 -
 51
51 -
 52
52 -
 53
53 -
 54
54 -
55
-
56
-
57
-
58
-
59
-
60
-
61
-
62
-
63
-
64
-
65
-
66
-
67
-
68
-
69
-
70
-
71
-
72
-
73
-
74
-
75
-
76
-
77
-
78
-
79
-
80
-
81
-
82
-
83
-
84
-
85
-
86
-
87
-
88
-
89
-
90
-
91
-
92
-
93
-
94
-
95
-
96
-
97
-
98
-
99
-
100
-
101
-
102
-
103
-
104
-
105
-
106
-
107
-
108
-
109
-
110
-
111
-
112
-
113
-
114
-
115
-
116
-
117
-
118
-
119
-
120
-
121
-
122
-
123
-
124
-
125
-
126
-
127
-
128
-
129
-
130
-
131
-
132
-
133
-
134
-
135
-
136
-
137
-
138
-
139
-
140
-
141
-
142
-
143
-
144
-
145
-
146
-
147
-
148
-
149
-
150
-
151
-
152
-
153
-
154
-
155
-
156
-
157
-
158
-
159
-
160
-
161
-
162
-
163
-
164
-
165
-
166
-
167
-
168
-
169
-
170
-
171
-
172
-
173
-
174
-
175
-
176
-
177
-
178
-
179
-
180
-
181
-
182
-
183
-
184
-
185
-
186
-
187
-
188
-
189
-
190
-
191
-
192
-
193
-
194
-
195
-
196
-
197
-
198
-
199
-
200
-
201
-
202
-
203
-
204
-
205
-
206
-
207
-
208
-
209
-
210
-
211
-
212
-
213
-
214
-
215
-
216
-
217
-
218
-
219
-
220
-
221
-
222
-
223
-
224
-
225
-
226
-
227
-
228
-
229
-
230
-
231
-
232
-
233
-
234
-
235
-
236
-
237
-
238
-
239
-
240
-
241
-
242
-
243
-
244
-
245
-
246
-
247
-
248
-
249
-
250
-
251
-
252
-
253
-
254
-
255
-
256
-
257
-
258
-
259
-
260
-
261
-
262
-
263
-
264
-
265
-
266
-
267
-
268
-
269
-
270
-
271
-
272
-
273
-
274
-
275
-
276
-
277
-
278
-
279
-
280
-
281
-
282
-
283
-
284
-
285
-
286
-
287
-
288
-
289
-
290
-
291
-
292
-
293
-
294
-
295
-
296
-
297
-
298
-
299
-
300
-
301
-
302
-
303
-
304
-
305
-
306
-
307
-
308
-
309
-
310
-
311
-
312
-
313
-
314
-
315
-
316
-
317
-
318
-
319
-
320
-
321
-
322
-
323
-
324
-
325
-
326
-
327
-
328
-
329
-
330
-
331
-
332
-
333
-
334
-
335
-
336
-
337
-
338
-
339
-
340
-
341
-
342
-
343
-
344
-
345
-
346
-
347
-
348
-
349
-
350
-
351
-
352
-
353
-
354
-
355
-
356
-
357
 |
 |

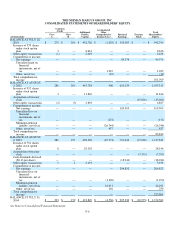
THE NEIMAN MARCUS GROUP, INC.
CONSOLIDATED STATEMENTS OF SHAREHOLDERS' EQUITY
(in thousands)
Common
Stocks Additional
Paid-In
Capital
Accumulated
Other
Comprehensive
Income (Loss)
Retained
Earnings
Treasury
Stock
Total
Shareholders'
Equity
Class
A
Class
B
BALANCE AT JULY 28,
2001 $ 278 $ 200 $ 432,726 $ (1,029) $ 510,565 $ — $ 942,740
Issuance of 339 shares
under stock option
plan 3 — 8,633 — — — 8,636
Other equity transactions (1) — 2,429 — — — 2,428
Comprehensive income:
Net earnings — — — — 99,574 — 99,574
Unrealized gain on
financial
instruments, net of
tax — — — 1,945 — — 1,945
Other, net of tax — — — (10) — — (10)
Total comprehensive
income 101,509
BALANCE AT AUGUST
3, 2002 280 200 443,788 906 610,139 — 1,055,313
Issuance of 392 shares
under stock option
plan 4 — 11,840 — — — 11,844
Acquisition of treasury
stock (15,020) (15,020)
Other equity transactions (2) (3) 2,892 — — — 2,887
Comprehensive income:
Net earnings — — — — 109,303 — 109,303
Unrealized loss on
financial
instruments, net of
tax — — — (172) — — (172)
Minimum pension
liability, net of tax — — — (26,744) — — (26,744)
Other, net of tax — — — 437 — — 437
Total comprehensive
income — — — — — — 82,824
BALANCE AT AUGUST
2, 2003 282 197 458,520 (25,573) 719,442 (15,020) 1,137,848
Issuance of 781 shares
under stock option
plan 8 — 28,138 — — — 28,146
Acquisition of treasury
stock — — — — — (7,553) (7,553)
Cash dividends declared
($0.13 per share) — — — — (18,944) — (18,944)
Other equity transactions 3 2 5,191 — — — 5,196
Comprehensive income:
Net earnings — — — — 204,832 — 204,832
Unrealized loss on
financial
instruments, net of
tax — — — (1,290) — — (1,290)
Minimum pension
liability, net of tax — — — 22,071 — — 22,071
Other, net of tax — — — 256 — — 256
Total comprehensive
income — 225,869
BALANCE AT JULY 31,
2004 $ 293 $ 199 $ 491,849 $ (4,536)$ 905,330 $ (22,573)$ 1,370,562
See Notes to Consolidated Financial Statements.
F-6