Neiman Marcus 2003 Annual Report Download - page 61
Download and view the complete annual report
Please find page 61 of the 2003 Neiman Marcus annual report below. You can navigate through the pages in the report by either clicking on the pages listed below, or by using the keyword search tool below to find specific information within the annual report.-
 1
1 -
2
-
3
-
4
-
5
-
6
-
7
-
8
-
9
-
10
-
11
-
12
-
13
-
14
-
15
-
16
-
17
-
18
-
19
-
20
-
21
-
22
-
23
-
24
-
25
-
26
-
27
-
28
-
29
-
30
-
31
-
32
-
33
-
34
-
35
-
36
-
37
-
38
-
39
-
40
-
41
-
42
-
43
-
44
-
45
-
46
-
47
-
48
-
49
-
50
-
 51
51 -
 52
52 -
 53
53 -
 54
54 -
 55
55 -
 56
56 -
 57
57 -
 58
58 -
 59
59 -
 60
60 -
 61
61 -
 62
62 -
 63
63 -
 64
64 -
 65
65 -
 66
66 -
 67
67 -
 68
68 -
 69
69 -
 70
70 -
 71
71 -
72
-
73
-
74
-
75
-
76
-
77
-
78
-
79
-
80
-
81
-
82
-
83
-
84
-
85
-
86
-
87
-
88
-
89
-
90
-
91
-
92
-
93
-
94
-
95
-
96
-
97
-
98
-
99
-
100
-
101
-
102
-
103
-
104
-
105
-
106
-
107
-
108
-
109
-
110
-
111
-
112
-
113
-
114
-
115
-
116
-
117
-
118
-
119
-
120
-
121
-
122
-
123
-
124
-
125
-
126
-
127
-
128
-
129
-
130
-
131
-
132
-
133
-
134
-
135
-
136
-
137
-
138
-
139
-
140
-
141
-
142
-
143
-
144
-
145
-
146
-
147
-
148
-
149
-
150
-
151
-
152
-
153
-
154
-
155
-
156
-
157
-
158
-
159
-
160
-
161
-
162
-
163
-
164
-
165
-
166
-
167
-
168
-
169
-
170
-
171
-
172
-
173
-
174
-
175
-
176
-
177
-
178
-
179
-
180
-
181
-
182
-
183
-
184
-
185
-
186
-
187
-
188
-
189
-
190
-
191
-
192
-
193
-
194
-
195
-
196
-
197
-
198
-
199
-
200
-
201
-
202
-
203
-
204
-
205
-
206
-
207
-
208
-
209
-
210
-
211
-
212
-
213
-
214
-
215
-
216
-
217
-
218
-
219
-
220
-
221
-
222
-
223
-
224
-
225
-
226
-
227
-
228
-
229
-
230
-
231
-
232
-
233
-
234
-
235
-
236
-
237
-
238
-
239
-
240
-
241
-
242
-
243
-
244
-
245
-
246
-
247
-
248
-
249
-
250
-
251
-
252
-
253
-
254
-
255
-
256
-
257
-
258
-
259
-
260
-
261
-
262
-
263
-
264
-
265
-
266
-
267
-
268
-
269
-
270
-
271
-
272
-
273
-
274
-
275
-
276
-
277
-
278
-
279
-
280
-
281
-
282
-
283
-
284
-
285
-
286
-
287
-
288
-
289
-
290
-
291
-
292
-
293
-
294
-
295
-
296
-
297
-
298
-
299
-
300
-
301
-
302
-
303
-
304
-
305
-
306
-
307
-
308
-
309
-
310
-
311
-
312
-
313
-
314
-
315
-
316
-
317
-
318
-
319
-
320
-
321
-
322
-
323
-
324
-
325
-
326
-
327
-
328
-
329
-
330
-
331
-
332
-
333
-
334
-
335
-
336
-
337
-
338
-
339
-
340
-
341
-
342
-
343
-
344
-
345
-
346
-
347
-
348
-
349
-
350
-
351
-
352
-
353
-
354
-
355
-
356
-
357
 |
 |

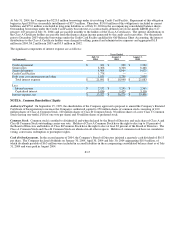
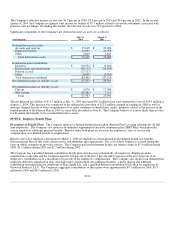
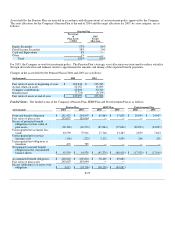
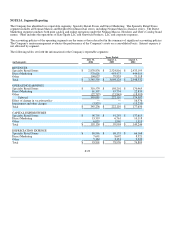
Costs of Benefits. The components of the expenses incurred by the Company under its Pension Plan, SERP Plan and Postretirement
Plan are as follows:
Years Ended
(in thousands)
July 31,
2004
August 2,
2003
August 3,
2002
Pension Plan:
Service cost $ 10,827 $ 9,110 $ 8,422
Interest cost 16,484 15,196 13,571
Expected return on plan assets (16,527) (14,591) (14,389)
Net amortization of losses and prior service costs 3,192 407 283
Pension Plan expense $ 13,976 $ 10,122 $ 7,887
SERP Plan:
Service cost $ 1,345 $ 1,159 $ 961
Interest cost 3,849 3,700 3,199
Net amortization of losses and prior service costs 1,444 1,181 200
SERP Plan expense $ 6,638 $ 6,040 $ 4,360
Postretirement Plan:
Service cost $ 81 $ 92 $ 86
Interest cost 1,570 1,614 1,214
Net amortization of losses 450 322 —
Postretirement expense $ 2,101 $ 2,028 $ 1,300
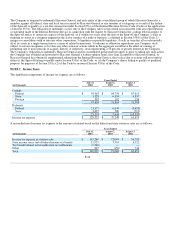
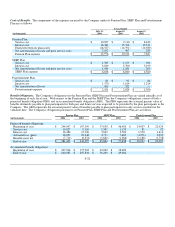
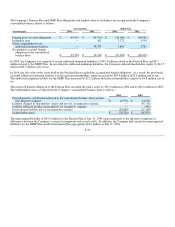
Benefit Obligations. The Company's obligations for the Pension Plan, SERP Plan and Postretirement Plan are valued annually as of
the beginning of each fiscal year. With respect to the Pension Plan and the SERP Plan, the Company's obligations consist of both a
projected benefit obligation (PBO) and an accumulated benefit obligation (ABO). The PBO represents the actuarial present value of
benefits ultimately payable to plan participants for both past and future services expected to be provided by the plan participants to the
Company. The ABO represents the actuarial present value of benefits payable to plan participants for only services rendered at the
valuation date. The Company's obligations pursuant to its Pension Plan, SERP Plan and Postretirement Plan are as follows:
Pension Plan SERP Plan Postretirement Plan
(in thousands) 2004 2003 2004 2003 2004 2003
Projected benefit obligations:
Beginning of year $ 244,997 $ 197,599 $ 57,638 $ 46,480 $ 24,907 $ 22,924
Service cost 10,827 9,110 1,345 1,159 81 92
Interest cost 16,484 15,196 3,849 3,700 1,570 1,614
Actuarial loss (gain) 16,829 29,446 4,713 7,665 (4,378) 2,035
Benefits paid, net (7,714)(6,354)(1,681)(1,366)(1,186)(1,758)
End of year $ 281,423 $ 244,997 $ 65,864 $ 57,638 $ 20,994 $ 24,907
Accumulated benefit obligations:
Beginning of year $ 207,834 $ 175,903 $ 49,082 $ 38,689
End of year $ 240,082 $ 207,834 $ 56,209 $ 49,082
F-22