Neiman Marcus 2003 Annual Report Download - page 62
Download and view the complete annual report
Please find page 62 of the 2003 Neiman Marcus annual report below. You can navigate through the pages in the report by either clicking on the pages listed below, or by using the keyword search tool below to find specific information within the annual report.-
 1
1 -
2
-
3
-
4
-
5
-
6
-
7
-
8
-
9
-
10
-
11
-
12
-
13
-
14
-
15
-
16
-
17
-
18
-
19
-
20
-
21
-
22
-
23
-
24
-
25
-
26
-
27
-
28
-
29
-
30
-
31
-
32
-
33
-
34
-
35
-
36
-
37
-
38
-
39
-
40
-
41
-
42
-
43
-
44
-
45
-
46
-
47
-
48
-
49
-
50
-
51
-
 52
52 -
 53
53 -
 54
54 -
 55
55 -
 56
56 -
 57
57 -
 58
58 -
 59
59 -
 60
60 -
 61
61 -
 62
62 -
 63
63 -
 64
64 -
 65
65 -
 66
66 -
 67
67 -
 68
68 -
 69
69 -
 70
70 -
 71
71 -
 72
72 -
73
-
74
-
75
-
76
-
77
-
78
-
79
-
80
-
81
-
82
-
83
-
84
-
85
-
86
-
87
-
88
-
89
-
90
-
91
-
92
-
93
-
94
-
95
-
96
-
97
-
98
-
99
-
100
-
101
-
102
-
103
-
104
-
105
-
106
-
107
-
108
-
109
-
110
-
111
-
112
-
113
-
114
-
115
-
116
-
117
-
118
-
119
-
120
-
121
-
122
-
123
-
124
-
125
-
126
-
127
-
128
-
129
-
130
-
131
-
132
-
133
-
134
-
135
-
136
-
137
-
138
-
139
-
140
-
141
-
142
-
143
-
144
-
145
-
146
-
147
-
148
-
149
-
150
-
151
-
152
-
153
-
154
-
155
-
156
-
157
-
158
-
159
-
160
-
161
-
162
-
163
-
164
-
165
-
166
-
167
-
168
-
169
-
170
-
171
-
172
-
173
-
174
-
175
-
176
-
177
-
178
-
179
-
180
-
181
-
182
-
183
-
184
-
185
-
186
-
187
-
188
-
189
-
190
-
191
-
192
-
193
-
194
-
195
-
196
-
197
-
198
-
199
-
200
-
201
-
202
-
203
-
204
-
205
-
206
-
207
-
208
-
209
-
210
-
211
-
212
-
213
-
214
-
215
-
216
-
217
-
218
-
219
-
220
-
221
-
222
-
223
-
224
-
225
-
226
-
227
-
228
-
229
-
230
-
231
-
232
-
233
-
234
-
235
-
236
-
237
-
238
-
239
-
240
-
241
-
242
-
243
-
244
-
245
-
246
-
247
-
248
-
249
-
250
-
251
-
252
-
253
-
254
-
255
-
256
-
257
-
258
-
259
-
260
-
261
-
262
-
263
-
264
-
265
-
266
-
267
-
268
-
269
-
270
-
271
-
272
-
273
-
274
-
275
-
276
-
277
-
278
-
279
-
280
-
281
-
282
-
283
-
284
-
285
-
286
-
287
-
288
-
289
-
290
-
291
-
292
-
293
-
294
-
295
-
296
-
297
-
298
-
299
-
300
-
301
-
302
-
303
-
304
-
305
-
306
-
307
-
308
-
309
-
310
-
311
-
312
-
313
-
314
-
315
-
316
-
317
-
318
-
319
-
320
-
321
-
322
-
323
-
324
-
325
-
326
-
327
-
328
-
329
-
330
-
331
-
332
-
333
-
334
-
335
-
336
-
337
-
338
-
339
-
340
-
341
-
342
-
343
-
344
-
345
-
346
-
347
-
348
-
349
-
350
-
351
-
352
-
353
-
354
-
355
-
356
-
357
 |
 |

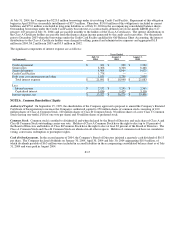
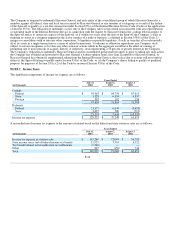
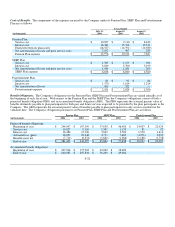
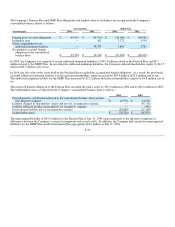
A summary of expected benefit payments related to the Company's Pension Plan, SERP Plan and Postretirement Plan is as follows:
(in thousands)
Pension
Plan
SERP
Plan
Postretirement
Plan
Fiscal year 2005 $ 8,800 $ 2,412 $ 1,484
Fiscal year 2006 9,454 2,553 1,535
Fiscal year 2007 10,192 2,733 1,567
Fiscal year 2008 11,039 2,760 1,593
Fiscal year 2009 12,009 3,293 1,614
Fiscal years 2010-2014 $ 78,041 $ 22,337 $ 8,042
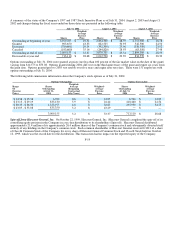
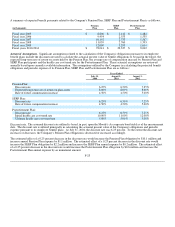
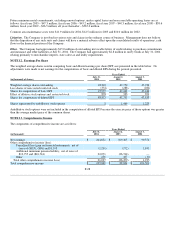
Actuarial Assumptions. Significant assumptions related to the calculation of the Company's obligations pursuant to its employee
benefit plans include the discount rate used to calculate the actuarial present value of benefit obligations to be paid in the future, the
expected long-term rate of return on assets held by the Pension Plan, the average rate of compensation increase by Pension Plan and
SERP Plan participants and the health care cost trend rate for the Postretirement Plan. These actuarial assumptions are reviewed
annually based upon currently available information. The assumptions utilized by the Company in calculating the projected benefit
obligations and periodic expense of its Pension Plan, SERP Plan and Postretirement Plan are as follows:
Years Ended
July 31,
2004
August 1,
2003
August 1,
2002
Pension Plan:
Discount rate 6.25% 6.50% 7.25%
Expected long-term rate of return on plan assets 8.00% 8.00% 8.00%
Rate of future compensation increase 4.50% 4.50% 5.00%
SERP Plan:
Discount rate 6.25% 6.50% 7.25%
Rate of future compensation increase 4.50% 4.50% 5.00%
Postretirement Plan:
Discount rate 6.25% 6.50% 7.25%
Initial health care cost trend rate 10.00% 11.00% 12.00%
Ultimate health care cost trend rate 5.00% 5.00% 5.00%
Discount rate. The assumed discount rate utilized is based, in part, upon the Moody's Aa corporate bond yield as of the measurement
date. The discount rate is utilized principally in calculating the actuarial present value of the Company's obligations and periodic
expense pursuant to its employee benefit plans. At July 31, 2004, the discount rate was 6.25 percent. To the extent the discount rate
increases or decreases, the Company's Pension Plan obligation is decreased or increased accordingly.
The estimated effect of a 0.25 percent decrease in the discount rate would increase the Pension Plan obligation by $10.1 million and
increase annual Pension Plan expense by $1.1 million. The estimated effect of a 0.25 percent decrease in the discount rate would
increase the SERP Plan obligation by $2.2 million and increase the SERP Plan annual expense by $0.2 million. The estimated effect
of a 0.25 percent decrease in the discount rate would increase the Postretirement Plan obligation by $0.6 million and increase the
Postretirement Plan annual expense by an immaterial amount.
F-23