Neiman Marcus 2003 Annual Report Download - page 42
Download and view the complete annual report
Please find page 42 of the 2003 Neiman Marcus annual report below. You can navigate through the pages in the report by either clicking on the pages listed below, or by using the keyword search tool below to find specific information within the annual report.-
 1
1 -
2
-
3
-
4
-
5
-
6
-
7
-
8
-
9
-
10
-
11
-
12
-
13
-
14
-
15
-
16
-
17
-
18
-
19
-
20
-
21
-
22
-
23
-
24
-
25
-
26
-
27
-
28
-
29
-
30
-
31
-
 32
32 -
 33
33 -
 34
34 -
 35
35 -
 36
36 -
 37
37 -
 38
38 -
 39
39 -
 40
40 -
 41
41 -
 42
42 -
 43
43 -
 44
44 -
 45
45 -
 46
46 -
 47
47 -
 48
48 -
 49
49 -
 50
50 -
 51
51 -
 52
52 -
53
-
54
-
55
-
56
-
57
-
58
-
59
-
60
-
61
-
62
-
63
-
64
-
65
-
66
-
67
-
68
-
69
-
70
-
71
-
72
-
73
-
74
-
75
-
76
-
77
-
78
-
79
-
80
-
81
-
82
-
83
-
84
-
85
-
86
-
87
-
88
-
89
-
90
-
91
-
92
-
93
-
94
-
95
-
96
-
97
-
98
-
99
-
100
-
101
-
102
-
103
-
104
-
105
-
106
-
107
-
108
-
109
-
110
-
111
-
112
-
113
-
114
-
115
-
116
-
117
-
118
-
119
-
120
-
121
-
122
-
123
-
124
-
125
-
126
-
127
-
128
-
129
-
130
-
131
-
132
-
133
-
134
-
135
-
136
-
137
-
138
-
139
-
140
-
141
-
142
-
143
-
144
-
145
-
146
-
147
-
148
-
149
-
150
-
151
-
152
-
153
-
154
-
155
-
156
-
157
-
158
-
159
-
160
-
161
-
162
-
163
-
164
-
165
-
166
-
167
-
168
-
169
-
170
-
171
-
172
-
173
-
174
-
175
-
176
-
177
-
178
-
179
-
180
-
181
-
182
-
183
-
184
-
185
-
186
-
187
-
188
-
189
-
190
-
191
-
192
-
193
-
194
-
195
-
196
-
197
-
198
-
199
-
200
-
201
-
202
-
203
-
204
-
205
-
206
-
207
-
208
-
209
-
210
-
211
-
212
-
213
-
214
-
215
-
216
-
217
-
218
-
219
-
220
-
221
-
222
-
223
-
224
-
225
-
226
-
227
-
228
-
229
-
230
-
231
-
232
-
233
-
234
-
235
-
236
-
237
-
238
-
239
-
240
-
241
-
242
-
243
-
244
-
245
-
246
-
247
-
248
-
249
-
250
-
251
-
252
-
253
-
254
-
255
-
256
-
257
-
258
-
259
-
260
-
261
-
262
-
263
-
264
-
265
-
266
-
267
-
268
-
269
-
270
-
271
-
272
-
273
-
274
-
275
-
276
-
277
-
278
-
279
-
280
-
281
-
282
-
283
-
284
-
285
-
286
-
287
-
288
-
289
-
290
-
291
-
292
-
293
-
294
-
295
-
296
-
297
-
298
-
299
-
300
-
301
-
302
-
303
-
304
-
305
-
306
-
307
-
308
-
309
-
310
-
311
-
312
-
313
-
314
-
315
-
316
-
317
-
318
-
319
-
320
-
321
-
322
-
323
-
324
-
325
-
326
-
327
-
328
-
329
-
330
-
331
-
332
-
333
-
334
-
335
-
336
-
337
-
338
-
339
-
340
-
341
-
342
-
343
-
344
-
345
-
346
-
347
-
348
-
349
-
350
-
351
-
352
-
353
-
354
-
355
-
356
-
357
 |
 |

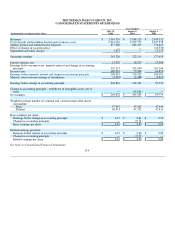
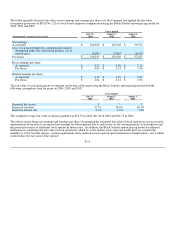
THE NEIMAN MARCUS GROUP, INC.
CONSOLIDATED STATEMENTS OF EARNINGS
Years Ended
(in thousands, except per share data)
July 31,
2004
August 2,
2003
August 3,
2002
Revenues $ 3,545,559 $ 3,098,124 $ 2,948,332
Cost of goods sold including buying and occupancy costs 2,321,110 2,073,579 1,997,378
Selling, general and administrative expenses 875,360 802,435 776,647
Effect of change in vacation policy — — (16,576)
Impairment and other charges 3,853 — 13,233
Operating earnings 345,236 222,110 177,650
Interest expense, net 15,923 16,270 15,406
Earnings before income taxes, minority interest and change in accounting
principle 329,313 205,840 162,244
Income taxes 120,932 79,248 61,653
Earnings before minority interest and change in accounting principle 208,381 126,592 100,591
Minority interest in net earnings of subsidiaries (3,549)(2,488)(1,017)
Earnings before change in accounting principle 204,832 124,104 99,574
Change in accounting principle – writedown of intangible assets, net of
taxes — (14,801)—
Net earnings $ 204,832 $ 109,303 $ 99,574
Weighted average number of common and common equivalent shares
outstanding:
Basic 47,997 47,462 47,444
Diluted 48,873 47,795 47,835
Basic earnings per share:
Earnings before change in accounting principle $ 4.27 $ 2.61 $ 2.10
Change in accounting principle — (0.31)—
Basic earnings per share $ 4.27 $ 2.30 $ 2.10
Diluted earnings per share:
Earnings before change in accounting principle $ 4.19 $ 2.60 $ 2.08
Change in accounting principle — (0.31)—
Diluted earnings per share $ 4.19 $ 2.29 $ 2.08
See Notes to Consolidated Financial Statements.
F-4