Neiman Marcus 2003 Annual Report Download - page 17
Download and view the complete annual report
Please find page 17 of the 2003 Neiman Marcus annual report below. You can navigate through the pages in the report by either clicking on the pages listed below, or by using the keyword search tool below to find specific information within the annual report.-
 1
1 -
2
-
3
-
4
-
5
-
6
-
 7
7 -
 8
8 -
 9
9 -
 10
10 -
 11
11 -
 12
12 -
 13
13 -
 14
14 -
 15
15 -
 16
16 -
 17
17 -
 18
18 -
 19
19 -
 20
20 -
 21
21 -
 22
22 -
 23
23 -
 24
24 -
 25
25 -
 26
26 -
 27
27 -
28
-
29
-
30
-
31
-
32
-
33
-
34
-
35
-
36
-
37
-
38
-
39
-
40
-
41
-
42
-
43
-
44
-
45
-
46
-
47
-
48
-
49
-
50
-
51
-
52
-
53
-
54
-
55
-
56
-
57
-
58
-
59
-
60
-
61
-
62
-
63
-
64
-
65
-
66
-
67
-
68
-
69
-
70
-
71
-
72
-
73
-
74
-
75
-
76
-
77
-
78
-
79
-
80
-
81
-
82
-
83
-
84
-
85
-
86
-
87
-
88
-
89
-
90
-
91
-
92
-
93
-
94
-
95
-
96
-
97
-
98
-
99
-
100
-
101
-
102
-
103
-
104
-
105
-
106
-
107
-
108
-
109
-
110
-
111
-
112
-
113
-
114
-
115
-
116
-
117
-
118
-
119
-
120
-
121
-
122
-
123
-
124
-
125
-
126
-
127
-
128
-
129
-
130
-
131
-
132
-
133
-
134
-
135
-
136
-
137
-
138
-
139
-
140
-
141
-
142
-
143
-
144
-
145
-
146
-
147
-
148
-
149
-
150
-
151
-
152
-
153
-
154
-
155
-
156
-
157
-
158
-
159
-
160
-
161
-
162
-
163
-
164
-
165
-
166
-
167
-
168
-
169
-
170
-
171
-
172
-
173
-
174
-
175
-
176
-
177
-
178
-
179
-
180
-
181
-
182
-
183
-
184
-
185
-
186
-
187
-
188
-
189
-
190
-
191
-
192
-
193
-
194
-
195
-
196
-
197
-
198
-
199
-
200
-
201
-
202
-
203
-
204
-
205
-
206
-
207
-
208
-
209
-
210
-
211
-
212
-
213
-
214
-
215
-
216
-
217
-
218
-
219
-
220
-
221
-
222
-
223
-
224
-
225
-
226
-
227
-
228
-
229
-
230
-
231
-
232
-
233
-
234
-
235
-
236
-
237
-
238
-
239
-
240
-
241
-
242
-
243
-
244
-
245
-
246
-
247
-
248
-
249
-
250
-
251
-
252
-
253
-
254
-
255
-
256
-
257
-
258
-
259
-
260
-
261
-
262
-
263
-
264
-
265
-
266
-
267
-
268
-
269
-
270
-
271
-
272
-
273
-
274
-
275
-
276
-
277
-
278
-
279
-
280
-
281
-
282
-
283
-
284
-
285
-
286
-
287
-
288
-
289
-
290
-
291
-
292
-
293
-
294
-
295
-
296
-
297
-
298
-
299
-
300
-
301
-
302
-
303
-
304
-
305
-
306
-
307
-
308
-
309
-
310
-
311
-
312
-
313
-
314
-
315
-
316
-
317
-
318
-
319
-
320
-
321
-
322
-
323
-
324
-
325
-
326
-
327
-
328
-
329
-
330
-
331
-
332
-
333
-
334
-
335
-
336
-
337
-
338
-
339
-
340
-
341
-
342
-
343
-
344
-
345
-
346
-
347
-
348
-
349
-
350
-
351
-
352
-
353
-
354
-
355
-
356
-
357
 |
 |

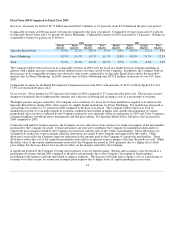
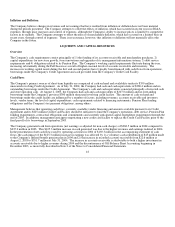
Fiscal Year 2004 Compared to Fiscal Year 2003
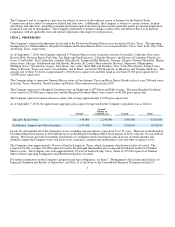
Revenues. Revenues for 2004 of $3.55 billion increased $447.4 million, or 14.4 percent, from $3.10 billion in the prior year period.
Comparable revenues in 2004 increased 14.0 percent compared to the prior year period. Comparable revenues increased 13.2 percent
for Specialty Retail Stores and 15.6 percent for Direct Marketing. Comparable revenues in 2003 increased by 3.8 percent. Changes in
comparable revenues by quarter are as follows:
2004 2003
Fourth
Quarter
Third
Quarter
Second
Quarter
First
Quarter
Fourth
Quarter
Third
Quarter
Second
Quarter
First
Quarter
Specialty Retail Stores 11.4% 22.1% 10.5% 9.5% 6.4% (0.3)% (2.1)% 4.8%
Direct Marketing 18.9% 11.9% 18.7% 11.9% 15.8% 10.8% 11.7% 12.3%
Total 12.5% 21.4% 12.2% 10.7% 8.5% 1.5% 0.5% 5.8%
The Company believes the increases in its comparable revenues in 2004 were the result of a higher level of consumer spending, in
general, with a higher increase coming from the affluent luxury customer served by the Company. In addition, the Company believes
the increases in its comparable revenues were driven by sales events conducted by its Specialty Retail Stores and by the growth of
internet sales for Direct Marketing. In 2004, internet sales by Direct Marketing were $241.8 million, an increase of over 50% from
2003.
Comparable revenues for the Brand Development Companies increased in 2004, with increases of 40.3% for Kate Spade LLC and
17.8% for Gurwitch Products, LLC.
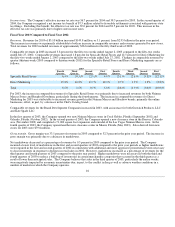
Gross margin. Gross margin was 34.5 percent of revenues in 2004 compared to 33.1 percent in the prior year. The increase in gross
margin was primarily due to higher product margins and a decrease in buying and occupancy costs as a percentage of revenues.
The higher product margins realized by the Company were a function of a lower level of net markdowns required to be taken by the
Specialty Retail Stores during 2004, offset, in part, by slightly higher markdowns for Direct Marketing. Net markdowns decreased as
a percentage of revenues by 0.7 percent in 2004 compared to the prior year period. The Company believes the lower level of
markdowns was due to 1) an improvement in economic conditions that resulted in higher sales and the discontinuance of various
promotional sales activities conducted by the Company in the prior year, primarily in the second quarter of 2003 and 2) the Company's
continued emphasis on both inventory management and full-price selling. For Specialty Retail Stores, full-price sales increased in
2004 compared to 2003.
Consistent with industry business practice, the Company receives allowances from certain of its vendors in support of the merchandise
purchased by the Company for resale. Certain allowances are received to reimburse the Company for markdowns taken and/or to
support the gross margins earned by the Company in connection with the sales of the vendor's merchandise. These allowances are
recognized as an increase to gross margin when the allowances are earned by the Company and approved by the vendor. Other
allowances received by the Company represent reductions to the amounts paid by the Company to acquire the merchandise. These
allowances reduce the cost of the acquired merchandise and result in an increase to gross margin at the time the goods are sold. While
the dollar value of the vendor reimbursements received by the Company decreased in 2004, primarily due to a higher level of full-
price selling, this decrease did not have an adverse effect on the margins realized by the Company.
A significant portion of the Company's buying and occupancy costs are fixed in nature. Buying and occupancy costs decreased as a
percentage of revenues during 2004 compared to the prior year primarily due to the Company's leveraging of fixed expenses,
including payroll expenses and rent and related occupancy expenses. The decrease in buying and occupancy costs as a percentage of
revenues was offset, in part, by an increase in depreciation expense due to higher levels of capital spending in recent years.
14