Neiman Marcus 2003 Annual Report Download - page 51
Download and view the complete annual report
Please find page 51 of the 2003 Neiman Marcus annual report below. You can navigate through the pages in the report by either clicking on the pages listed below, or by using the keyword search tool below to find specific information within the annual report.-
 1
1 -
2
-
3
-
4
-
5
-
6
-
7
-
8
-
9
-
10
-
11
-
12
-
13
-
14
-
15
-
16
-
17
-
18
-
19
-
20
-
21
-
22
-
23
-
24
-
25
-
26
-
27
-
28
-
29
-
30
-
31
-
32
-
33
-
34
-
35
-
36
-
37
-
38
-
39
-
40
-
 41
41 -
 42
42 -
 43
43 -
 44
44 -
 45
45 -
 46
46 -
 47
47 -
 48
48 -
 49
49 -
 50
50 -
 51
51 -
 52
52 -
 53
53 -
 54
54 -
 55
55 -
 56
56 -
 57
57 -
 58
58 -
 59
59 -
 60
60 -
 61
61 -
62
-
63
-
64
-
65
-
66
-
67
-
68
-
69
-
70
-
71
-
72
-
73
-
74
-
75
-
76
-
77
-
78
-
79
-
80
-
81
-
82
-
83
-
84
-
85
-
86
-
87
-
88
-
89
-
90
-
91
-
92
-
93
-
94
-
95
-
96
-
97
-
98
-
99
-
100
-
101
-
102
-
103
-
104
-
105
-
106
-
107
-
108
-
109
-
110
-
111
-
112
-
113
-
114
-
115
-
116
-
117
-
118
-
119
-
120
-
121
-
122
-
123
-
124
-
125
-
126
-
127
-
128
-
129
-
130
-
131
-
132
-
133
-
134
-
135
-
136
-
137
-
138
-
139
-
140
-
141
-
142
-
143
-
144
-
145
-
146
-
147
-
148
-
149
-
150
-
151
-
152
-
153
-
154
-
155
-
156
-
157
-
158
-
159
-
160
-
161
-
162
-
163
-
164
-
165
-
166
-
167
-
168
-
169
-
170
-
171
-
172
-
173
-
174
-
175
-
176
-
177
-
178
-
179
-
180
-
181
-
182
-
183
-
184
-
185
-
186
-
187
-
188
-
189
-
190
-
191
-
192
-
193
-
194
-
195
-
196
-
197
-
198
-
199
-
200
-
201
-
202
-
203
-
204
-
205
-
206
-
207
-
208
-
209
-
210
-
211
-
212
-
213
-
214
-
215
-
216
-
217
-
218
-
219
-
220
-
221
-
222
-
223
-
224
-
225
-
226
-
227
-
228
-
229
-
230
-
231
-
232
-
233
-
234
-
235
-
236
-
237
-
238
-
239
-
240
-
241
-
242
-
243
-
244
-
245
-
246
-
247
-
248
-
249
-
250
-
251
-
252
-
253
-
254
-
255
-
256
-
257
-
258
-
259
-
260
-
261
-
262
-
263
-
264
-
265
-
266
-
267
-
268
-
269
-
270
-
271
-
272
-
273
-
274
-
275
-
276
-
277
-
278
-
279
-
280
-
281
-
282
-
283
-
284
-
285
-
286
-
287
-
288
-
289
-
290
-
291
-
292
-
293
-
294
-
295
-
296
-
297
-
298
-
299
-
300
-
301
-
302
-
303
-
304
-
305
-
306
-
307
-
308
-
309
-
310
-
311
-
312
-
313
-
314
-
315
-
316
-
317
-
318
-
319
-
320
-
321
-
322
-
323
-
324
-
325
-
326
-
327
-
328
-
329
-
330
-
331
-
332
-
333
-
334
-
335
-
336
-
337
-
338
-
339
-
340
-
341
-
342
-
343
-
344
-
345
-
346
-
347
-
348
-
349
-
350
-
351
-
352
-
353
-
354
-
355
-
356
-
357
 |
 |

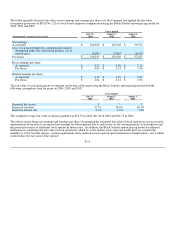
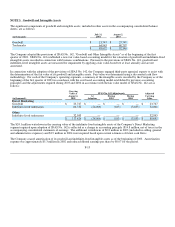
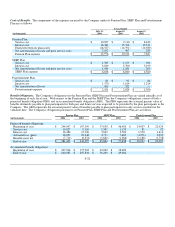
The following table illustrates the effect on net earnings and earnings per share as if the Company had applied the fair value
recognition provisions of SFAS No. 123 to stock-based employee compensation using the Black-Scholes option-pricing model for
2004, 2003 and 2002:
Years Ended
(in thousands, except per share data)
July 31,
2004
August 2,
2003
August 3,
2002
Net earnings:
As reported $ 204,832 $ 109,303 $ 99,574
Less: stock-based employee compensation expense
determined under fair value based method, net of
related taxes (8,687)(7,847)(6,542)
Pro forma $ 196,145 $ 101,456 $ 93,032
Basic earnings per share:
As reported $ 4.27 $ 2.30 $ 2.10
Pro forma $ 4.09 $ 2.14 $ 1.96
Diluted earnings per share:
As reported $ 4.19 $ 2.29 $ 2.08
Pro forma $ 4.01 $ 2.12 $ 1.94
The fair value of each option grant is estimated on the date of the grant using the Black-Scholes option pricing model with the
following assumptions used for grants in 2004, 2003 and 2002:
Years Ended
July 31,
2004
August 2,
2003
August 3,
2002
Expected life (years) 5 5 7
Expected volatility 32.7% 36.6% 40.7%
Risk-free interest rate 3.1% 3.0% 5.4%
The weighted-average fair value of options granted was $14.79 in 2004, $11.40 in 2003 and $12.73 in 2002.
The effects on pro forma net earnings and earnings per share of expensing the estimated fair value of stock options are not necessarily
representative of the effects on reported net earnings for future periods due to such factors as the vesting periods of stock options and
the potential issuance of additional stock options in future years. In addition, the Black-Scholes option-pricing model has inherent
limitations in calculating the fair value of stock options for which no active market exists since the model does not consider the
inability to sell or transfer options, vesting requirements and a reduced exercise period upon termination of employment - all of which
would reduce the fair value of the options.
F-12