Neiman Marcus 2003 Annual Report Download - page 22
Download and view the complete annual report
Please find page 22 of the 2003 Neiman Marcus annual report below. You can navigate through the pages in the report by either clicking on the pages listed below, or by using the keyword search tool below to find specific information within the annual report.-
 1
1 -
2
-
3
-
4
-
5
-
6
-
7
-
8
-
9
-
10
-
11
-
 12
12 -
 13
13 -
 14
14 -
 15
15 -
 16
16 -
 17
17 -
 18
18 -
 19
19 -
 20
20 -
 21
21 -
 22
22 -
 23
23 -
 24
24 -
 25
25 -
 26
26 -
 27
27 -
 28
28 -
 29
29 -
 30
30 -
 31
31 -
 32
32 -
33
-
34
-
35
-
36
-
37
-
38
-
39
-
40
-
41
-
42
-
43
-
44
-
45
-
46
-
47
-
48
-
49
-
50
-
51
-
52
-
53
-
54
-
55
-
56
-
57
-
58
-
59
-
60
-
61
-
62
-
63
-
64
-
65
-
66
-
67
-
68
-
69
-
70
-
71
-
72
-
73
-
74
-
75
-
76
-
77
-
78
-
79
-
80
-
81
-
82
-
83
-
84
-
85
-
86
-
87
-
88
-
89
-
90
-
91
-
92
-
93
-
94
-
95
-
96
-
97
-
98
-
99
-
100
-
101
-
102
-
103
-
104
-
105
-
106
-
107
-
108
-
109
-
110
-
111
-
112
-
113
-
114
-
115
-
116
-
117
-
118
-
119
-
120
-
121
-
122
-
123
-
124
-
125
-
126
-
127
-
128
-
129
-
130
-
131
-
132
-
133
-
134
-
135
-
136
-
137
-
138
-
139
-
140
-
141
-
142
-
143
-
144
-
145
-
146
-
147
-
148
-
149
-
150
-
151
-
152
-
153
-
154
-
155
-
156
-
157
-
158
-
159
-
160
-
161
-
162
-
163
-
164
-
165
-
166
-
167
-
168
-
169
-
170
-
171
-
172
-
173
-
174
-
175
-
176
-
177
-
178
-
179
-
180
-
181
-
182
-
183
-
184
-
185
-
186
-
187
-
188
-
189
-
190
-
191
-
192
-
193
-
194
-
195
-
196
-
197
-
198
-
199
-
200
-
201
-
202
-
203
-
204
-
205
-
206
-
207
-
208
-
209
-
210
-
211
-
212
-
213
-
214
-
215
-
216
-
217
-
218
-
219
-
220
-
221
-
222
-
223
-
224
-
225
-
226
-
227
-
228
-
229
-
230
-
231
-
232
-
233
-
234
-
235
-
236
-
237
-
238
-
239
-
240
-
241
-
242
-
243
-
244
-
245
-
246
-
247
-
248
-
249
-
250
-
251
-
252
-
253
-
254
-
255
-
256
-
257
-
258
-
259
-
260
-
261
-
262
-
263
-
264
-
265
-
266
-
267
-
268
-
269
-
270
-
271
-
272
-
273
-
274
-
275
-
276
-
277
-
278
-
279
-
280
-
281
-
282
-
283
-
284
-
285
-
286
-
287
-
288
-
289
-
290
-
291
-
292
-
293
-
294
-
295
-
296
-
297
-
298
-
299
-
300
-
301
-
302
-
303
-
304
-
305
-
306
-
307
-
308
-
309
-
310
-
311
-
312
-
313
-
314
-
315
-
316
-
317
-
318
-
319
-
320
-
321
-
322
-
323
-
324
-
325
-
326
-
327
-
328
-
329
-
330
-
331
-
332
-
333
-
334
-
335
-
336
-
337
-
338
-
339
-
340
-
341
-
342
-
343
-
344
-
345
-
346
-
347
-
348
-
349
-
350
-
351
-
352
-
353
-
354
-
355
-
356
-
357
 |
 |

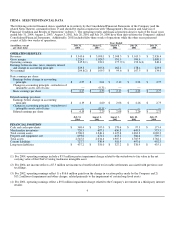
The discontinuance of Off-Balance Sheet Accounting had the impact of increasing accounts receivable for transfers to the Trust in
2004 no longer qualifying for Off-Balance Sheet Accounting. The Company's total credit card and other accounts receivable portfolio
increased from $490.7 million at August 2, 2003 to $551.7 million at July 31, 2004. This $61.0 million increase is shown in the 2004
consolidated statement of cash flows as follows:
Operating activities:
Increase in accounts receivable $ (529.1)
Investing activities:
Purchases of held-to-maturity securities (Retained Interests) (240.8)
Maturities of hold-to-maturity securities (Retained Interests) 483.4
242.6
Financing activities:
Borrowings under Credit Card Facility 225.0
Change in other comprehensive income 0.5
Net increase in total credit card and other accounts receivable portfolio $ (61.0)
Net cash provided by investing activities was $127.6 million in 2004 while net cash used for investing activities was $134.0 million in
2003. The increase in cash provided by investing activities in 2004 was primarily due to the impact of the discontinuance of Off-
Balance Sheet Accounting, offset by a higher level of capital expenditures.
Capital expenditures were $118.1 million in 2004 and $100.0 million in 2003. In 2004, the Company's primary capital expenditures
related to 1) the on-going expansions and renovations of the Company's stores in San Francisco, California and Newport Beach,
California, 2) the renovation of the main Bergdorf Goodman store in New York City, 3) the expansion of the distribution facility in
Longview, Texas and 4) upgrades to the Company's information systems, including the completion of the installation of a new point-
of-sale system begun in 2003. In 2003, major projects included the on-going expansions and renovations of the San Francisco and
Newport Beach stores, the completed remodel of the Las Vegas, Nevada store and the construction of new stores in Orlando, Florida
and Coral Gables, Florida. In addition, in 2003, the Company implemented various financial and non-merchandise procurement
modules of Oracle to replace previous systems and began the rollout of a new point-of-sale system in the Company's retail stores.
The Company currently projects capital expenditures for 2005 to be approximately $160 million to $170 million primarily for new
store construction, store renovations and upgrades to information systems, including warehousing systems to support the Company's
Direct Marketing operation and a new human capital management system. The Company expects to complete the expansion and
renovation of the Newport Beach store in the spring of fiscal year 2005 and the San Francisco store in the spring of fiscal year 2006.
Net cash provided by financing activities was $226.1 million in 2004. Net cash used for financing activities was $6.8 million in 2003.
In 2004, the Company recorded $225.0 million of borrowings under the Credit Card Facility as a consequence of the discontinuance of
Off-Balance Sheet Accounting and incurred no borrowings on its Credit Agreement. In 2004, the Company also repurchased
approximately $7.6 million of the Company's stock pursuant to the Company's stock repurchase program. During 2003, the Company
borrowed and repaid $80 million on the Company's previous revolving credit facility to fund seasonal working capital requirements.
19