Mercedes 2012 Annual Report Download - page 2
Download and view the complete annual report
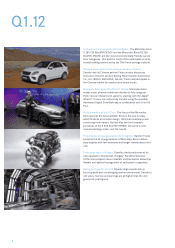
Please find page 2 of the 2012 Mercedes annual report below. You can navigate through the pages in the report by either clicking on the pages listed below, or by using the keyword search tool below to find specific information within the annual report.-
 1
1 -
 2
2 -
 3
3 -
 4
4 -
 5
5 -
 6
6 -
 7
7 -
 8
8 -
 9
9 -
 10
10 -
 11
11 -
 12
12 -
 13
13 -
14
-
15
-
16
-
17
-
18
-
19
-
20
-
21
-
22
-
23
-
24
-
25
-
26
-
27
-
28
-
29
-
30
-
31
-
32
-
33
-
34
-
35
-
36
-
37
-
38
-
39
-
40
-
41
-
42
-
43
-
44
-
45
-
46
-
47
-
48
-
49
-
50
-
51
-
52
-
53
-
54
-
55
-
56
-
57
-
58
-
59
-
60
-
61
-
62
-
63
-
64
-
65
-
66
-
67
-
68
-
69
-
70
-
71
-
72
-
73
-
74
-
75
-
76
-
77
-
78
-
79
-
80
-
81
-
82
-
83
-
84
-
85
-
86
-
87
-
88
-
89
-
90
-
91
-
92
-
93
-
94
-
95
-
96
-
97
-
98
-
99
-
100
-
101
-
102
-
103
-
104
-
105
-
106
-
107
-
108
-
109
-
110
-
111
-
112
-
113
-
114
-
115
-
116
-
117
-
118
-
119
-
120
-
121
-
122
-
123
-
124
-
125
-
126
-
127
-
128
-
129
-
130
-
131
-
132
-
133
-
134
-
135
-
136
-
137
-
138
-
139
-
140
-
141
-
142
-
143
-
144
-
145
-
146
-
147
-
148
-
149
-
150
-
151
-
152
-
153
-
154
-
155
-
156
-
157
-
158
-
159
-
160
-
161
-
162
-
163
-
164
-
165
-
166
-
167
-
168
-
169
-
170
-
171
-
172
-
173
-
174
-
175
-
176
-
177
-
178
-
179
-
180
-
181
-
182
-
183
-
184
-
185
-
186
-
187
-
188
-
189
-
190
-
191
-
192
-
193
-
194
-
195
-
196
-
197
-
198
-
199
-
200
-
201
-
202
-
203
-
204
-
205
-
206
-
207
-
208
-
209
-
210
-
211
-
212
-
213
-
214
-
215
-
216
-
217
-
218
-
219
-
220
-
221
-
222
-
223
-
224
-
225
-
226
-
227
-
228
-
229
-
230
-
231
-
232
-
233
-
234
-
235
-
236
-
237
-
238
-
239
-
240
-
241
-
242
-
243
-
244
-
245
-
246
-
247
-
248
-
249
-
250
-
251
-
252
-
253
-
254
-
255
-
256
-
257
-
258
-
259
-
260
-
261
-
262
-
263
-
264
-
265
-
266
-
267
-
268
-
269
-
270
-
271
-
272
-
273
-
274
-
275
-
276
-
277
-
278
-
279
-
280
 |
 |

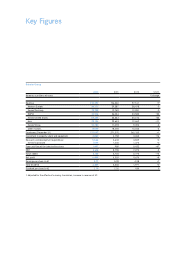
Key Figures
Daimler Group
2012 2011 2010 12/11
Amounts in millions of euros % change
Revenue 114 , 2 97 106,540 97,761 +71
Western Europe 39,377 39,387 38,478 -0
thereof Germany 19,722 19,753 19,281 -0
NAFTA 31,914 26,026 23,582 +23
thereof United States 27,233 22,222 20,216 +23
Asia 25,126 22,643 19,659 +11
thereof China 10,782 11,093 9,094 -3
Other markets 17,880 18,484 16,042 -3
Employees (December 31) 275,087 271,370 260,100 +1
Investment in property, plant and equipment 4,827 4,158 3,653 +16
Research and development expenditure
thereof capitalized
5,644
1,465
5,634
1,460
4,849
1,373
+0
+0
Free cash flow of the industrial business 1,452 989 5,432 +47
EBIT 8,615 8,755 7,274 -2
Value added 4,185 3,726 2,773 +12
Net profit 6,495 6,029 4,674 +8
Earnings per share (in €) 5.71 5.32 4.28 +7
Total dividend 2,349 2,346 1,971 +0
Dividend per share (in €) 2.20 2.20 1.85 0
1 Adjusted for the effects of currency translation, increase in revenue of 4%.