Mercedes 2010 Annual Report Download - page 2
Download and view the complete annual report
Please find page 2 of the 2010 Mercedes annual report below. You can navigate through the pages in the report by either clicking on the pages listed below, or by using the keyword search tool below to find specific information within the annual report.-
 1
1 -
 2
2 -
 3
3 -
 4
4 -
 5
5 -
 6
6 -
 7
7 -
 8
8 -
 9
9 -
 10
10 -
 11
11 -
 12
12 -
 13
13 -
14
-
15
-
16
-
17
-
18
-
19
-
20
-
21
-
22
-
23
-
24
-
25
-
26
-
27
-
28
-
29
-
30
-
31
-
32
-
33
-
34
-
35
-
36
-
37
-
38
-
39
-
40
-
41
-
42
-
43
-
44
-
45
-
46
-
47
-
48
-
49
-
50
-
51
-
52
-
53
-
54
-
55
-
56
-
57
-
58
-
59
-
60
-
61
-
62
-
63
-
64
-
65
-
66
-
67
-
68
-
69
-
70
-
71
-
72
-
73
-
74
-
75
-
76
-
77
-
78
-
79
-
80
-
81
-
82
-
83
-
84
-
85
-
86
-
87
-
88
-
89
-
90
-
91
-
92
-
93
-
94
-
95
-
96
-
97
-
98
-
99
-
100
-
101
-
102
-
103
-
104
-
105
-
106
-
107
-
108
-
109
-
110
-
111
-
112
-
113
-
114
-
115
-
116
-
117
-
118
-
119
-
120
-
121
-
122
-
123
-
124
-
125
-
126
-
127
-
128
-
129
-
130
-
131
-
132
-
133
-
134
-
135
-
136
-
137
-
138
-
139
-
140
-
141
-
142
-
143
-
144
-
145
-
146
-
147
-
148
-
149
-
150
-
151
-
152
-
153
-
154
-
155
-
156
-
157
-
158
-
159
-
160
-
161
-
162
-
163
-
164
-
165
-
166
-
167
-
168
-
169
-
170
-
171
-
172
-
173
-
174
-
175
-
176
-
177
-
178
-
179
-
180
-
181
-
182
-
183
-
184
-
185
-
186
-
187
-
188
-
189
-
190
-
191
-
192
-
193
-
194
-
195
-
196
-
197
-
198
-
199
-
200
-
201
-
202
-
203
-
204
-
205
-
206
-
207
-
208
-
209
-
210
-
211
-
212
-
213
-
214
-
215
-
216
-
217
-
218
-
219
-
220
-
221
-
222
-
223
-
224
-
225
-
226
-
227
-
228
-
229
-
230
-
231
-
232
-
233
-
234
-
235
-
236
-
237
-
238
-
239
-
240
-
241
-
242
-
243
-
244
-
245
-
246
-
247
-
248
-
249
-
250
-
251
-
252
-
253
-
254
-
255
-
256
-
257
-
258
-
259
-
260
 |
 |

Key Figures
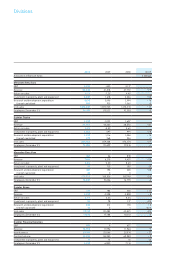
Daimler’s Divisions >
Daimler at a Glance >
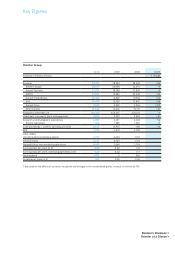
Daimler Group
2010 2009 2008 10/09
Amounts in millions of euros % change
Revenue 97,761 78,924 98,469 +24
Western Europe 38,478 36,458 46,276 +6
thereof Germany 19,281 18,788 21,832 +3
NAFTA 23,582 19,380 23,243 +22
thereof United States 20,216 16,569 19,956 +22
Asia 19,659 12,435 13,840 +58
thereof China 9,094 4,349 3,226 +109
Other markets 16,042 10,651 15,110 +51
Employees (December 31) 260,100 256,407 273,216 +1
Investment in property, plant and equipment 3,653 2,423 3,559 +51
Research and development expenditure
thereof capitalized
4,849
1,373
4,181
1,285
4,442
1,387
+16
+7
Cash provided by / used for operating activities 8,544 10,961 -786 -22
EBIT 7, 274 -1,513 2,730 .
Value added
(including discontinued operations)
2,773 -4,644 -1,147
.
Net profit/loss 4,674 -2,644 1,414 .
Net profit/loss from continuing operations 4,674 -2,644 1,704 .
Earnings/loss per share (in €) 4.28 -2.63 1.41 .
Earnings/loss per share, continuing operations (in €) 4.28 -2.63 1.71 .
Total dividend 1,971 0556 .
Dividend per share (in €) 1.85 0.00 0.60 .
1 Adjusted for the effects of currency translation and changes in the consolidated group, increase in revenue of 19%.
1